AtlasLog in

Grades 9–12 and AP

High School social studies

Social studies7
History

AP US History

No. 017 pages

Contact and conquest

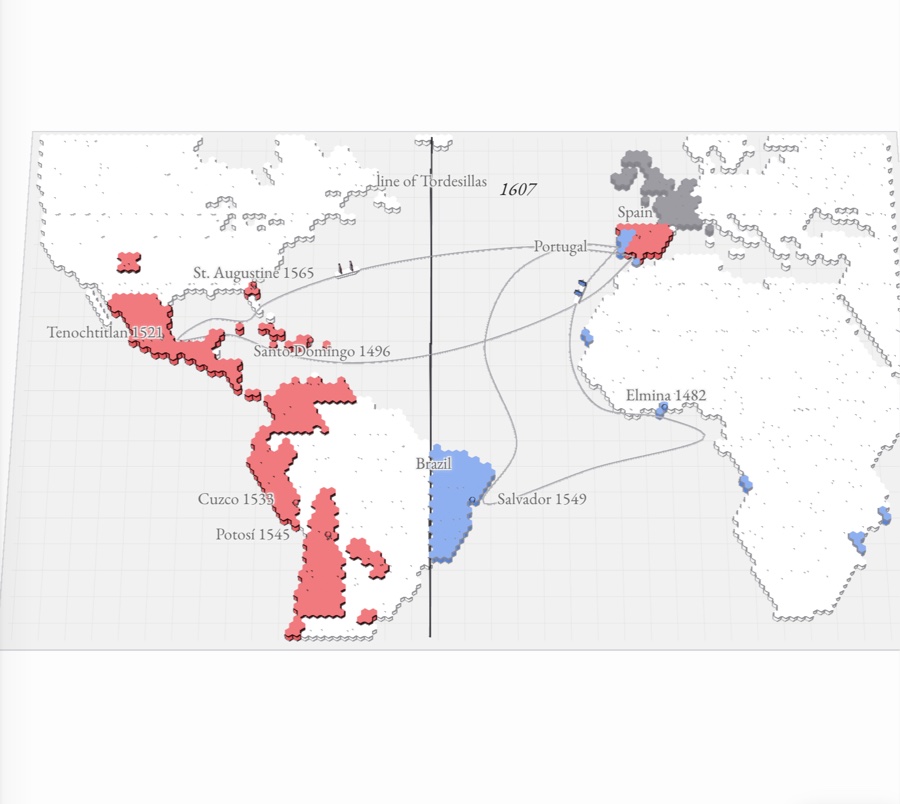
The Atlantic world as a paper relief map: Spain’s American empire raised in red from Mexico to Chile, Portugal’s Brazil in blue east of the Tordesillas line, Portuguese forts along the African coast, and fleets crossing the ocean
No. 028 pages

Colonial America

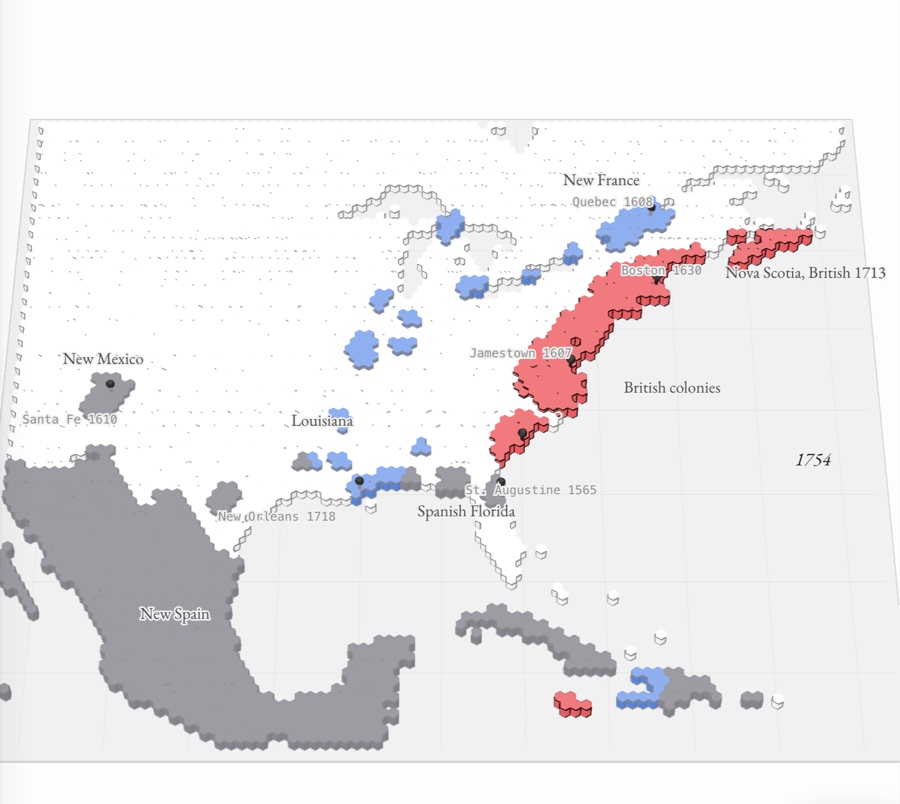
A relief map of North America in 1754: red English colonies along the Atlantic coast, blue French posts along the St. Lawrence, Great Lakes and Mississippi, and gray Spanish lands in Mexico, the Caribbean, Florida and New Mexico
No. 0313 pages

Revolution and the Constitution
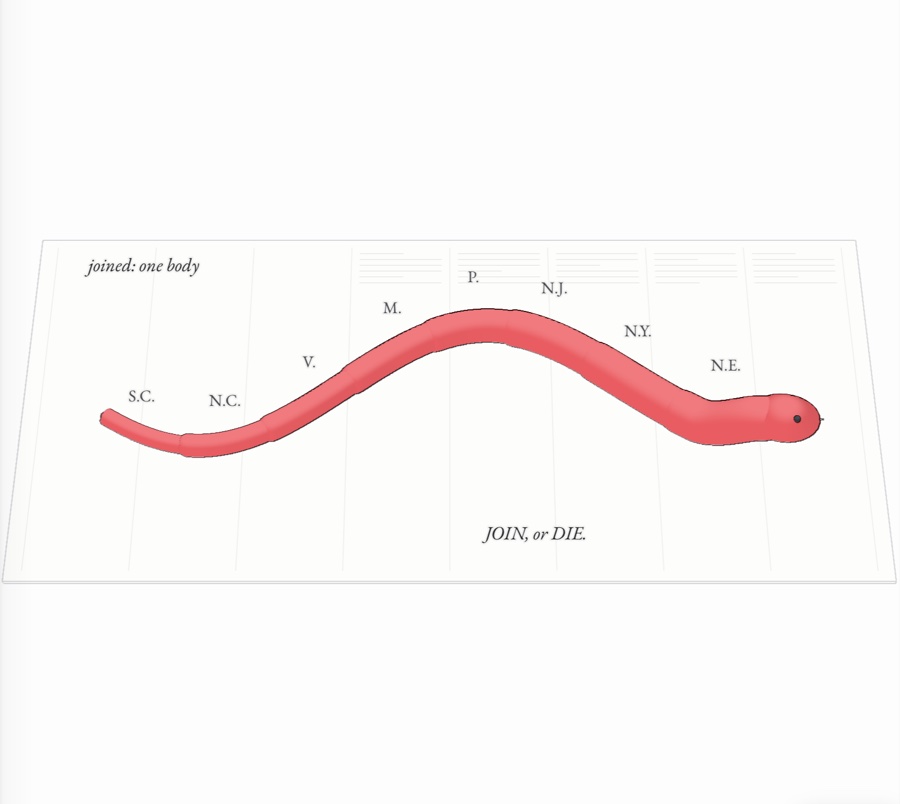
Franklin’s “Join, or Die” snake in eight red paper pieces, labeled N.E. to S.C., sliding together into one body on a newspaper page
No. 0414 pages

The early republic

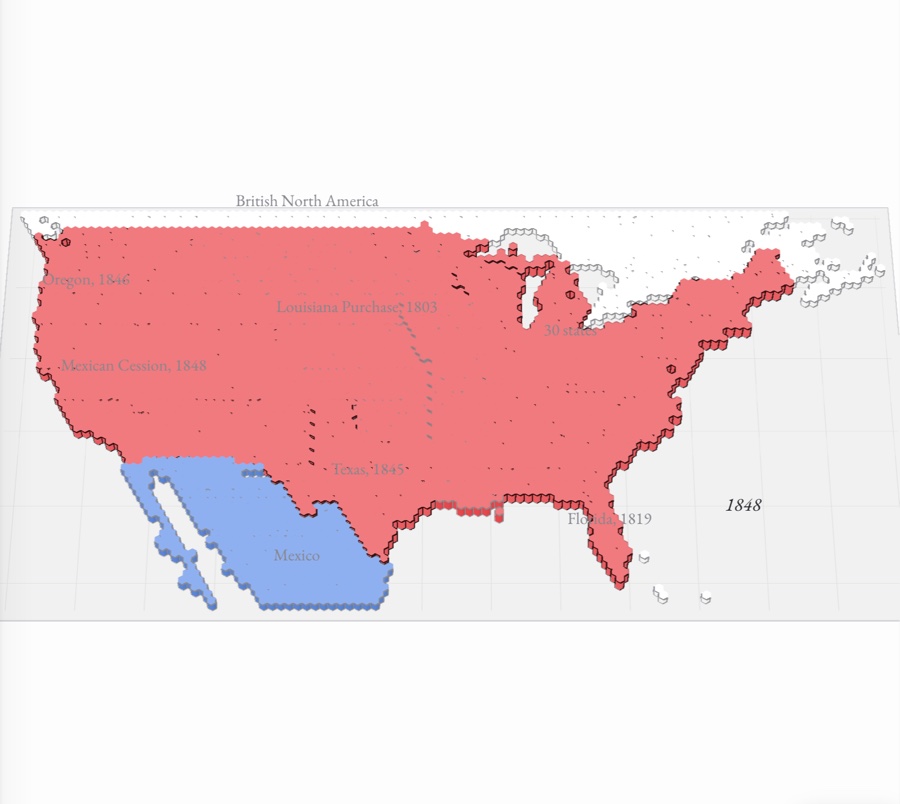
A hex-tile map of North America in which the United States, in red, grows west through the Louisiana Purchase, Florida, Texas, Oregon and the Mexican Cession, against blue Spanish and Mexican lands
No. 0512 pages

Civil War and Reconstruction
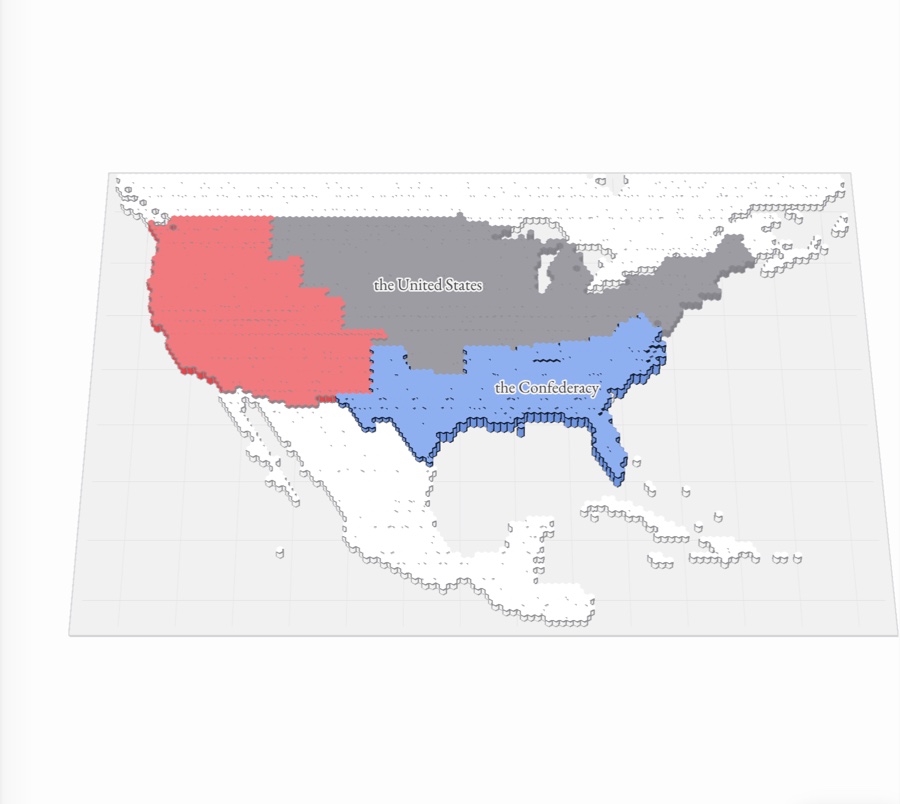
The United States from 1844 to 1877 in paper relief: the nation grows to the Pacific in red, the Confederacy rises in blue, and Union-held land spreads through it until the states are readmitted
No. 0614 pages

The Gilded Age

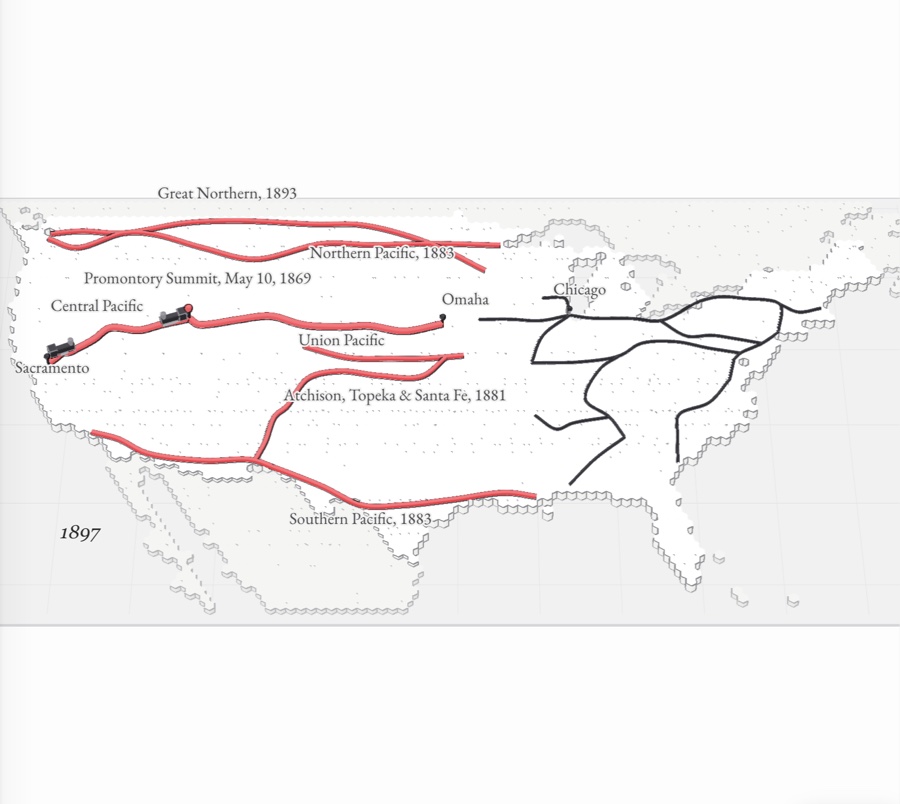
A paper-relief map of the United States with the Union Pacific and Central Pacific joined at Promontory Summit and red transcontinental lines spreading across the West, beside the dense network of the East
No. 0715 pages

Empire, war and depression
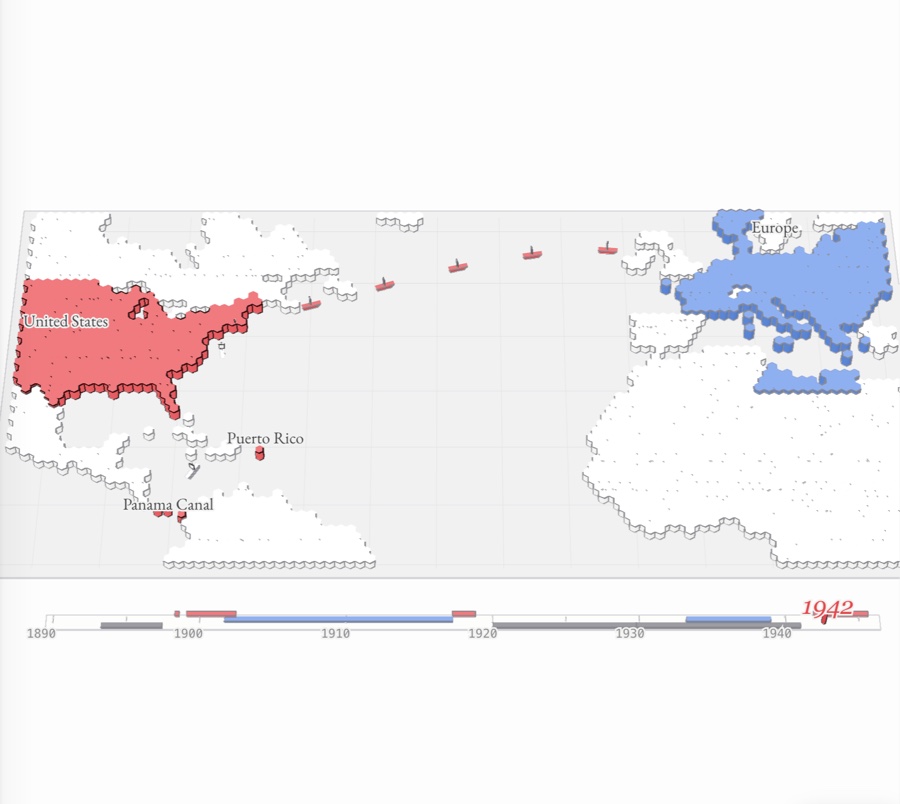
The Atlantic world as hex relief: the United States in red with Puerto Rico and the Panama Canal Zone, Axis-held Europe in blue, and convoys of red ships crossing the ocean, above a 1890–1945 timeline
No. 0815 pages

Cold War and civil rights
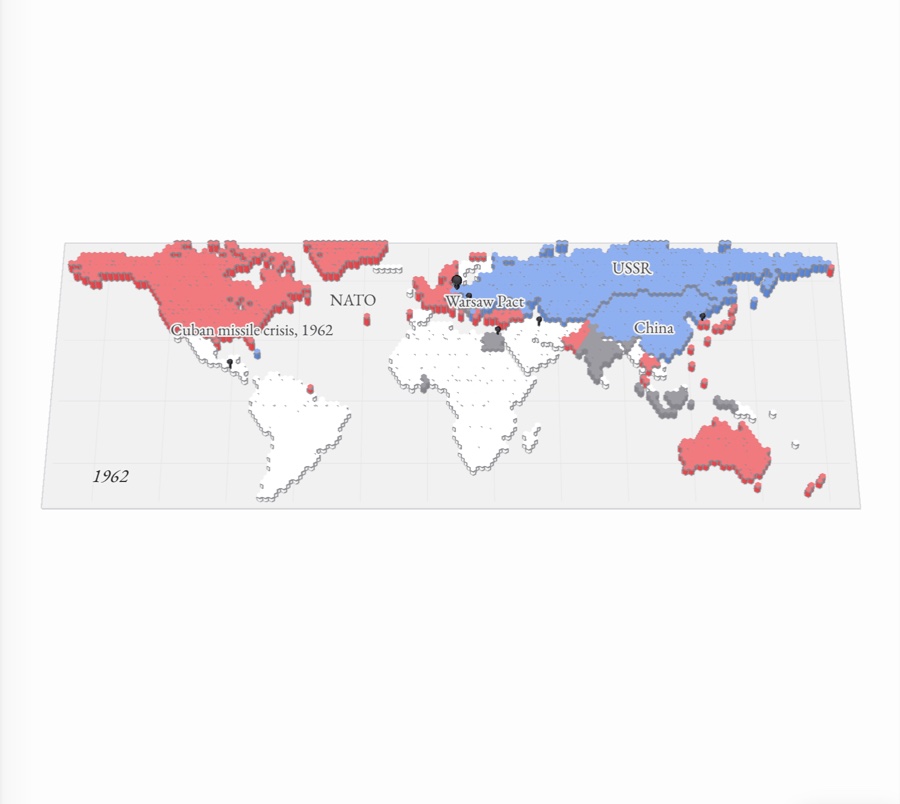
A world map in paper relief: the United States, Western Europe and their treaty allies raised in red, the Soviet Union, Eastern Europe and China in blue, the nonaligned states in gray, with pins marking the Cold War’s crises
No. 097 pages

Conservatism and a global age
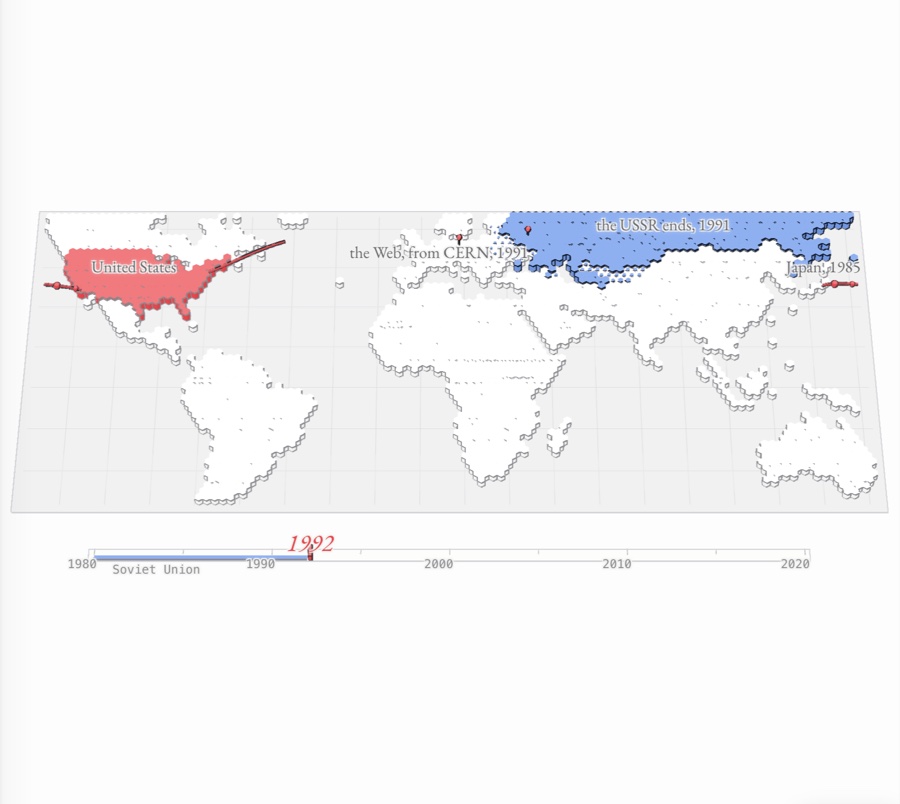
A hex-tile map of the world in 1990: the United States raised in red, the Soviet Union and Eastern Europe in blue as they sink away, and red trade links arcing out across the Atlantic and Pacific

AP World History: Modern

No. 108 pages

The global tapestry
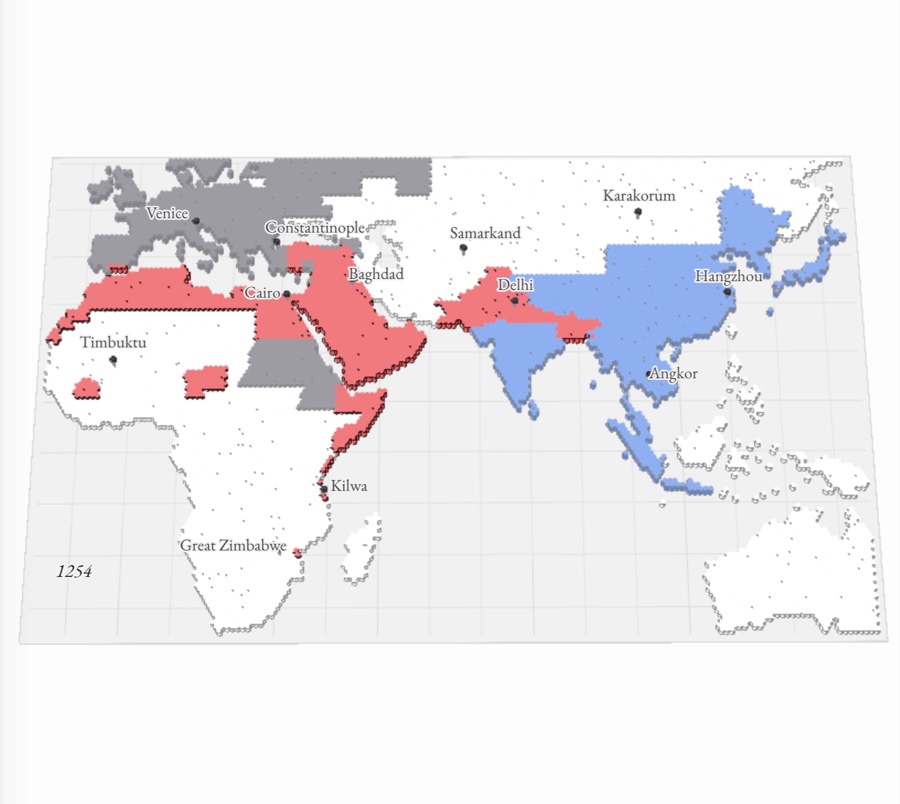
Afro-Eurasia in the mid-1200s as a paper-relief hex map colored by the faith of its rulers: red Muslim lands from Morocco to Delhi, blue Buddhist, Hindu and Confucian Asia, gray Christian Europe and Ethiopia, and a white gap where the Mongols ruled Iran and Central Asia
No. 118 pages

Networks of exchange

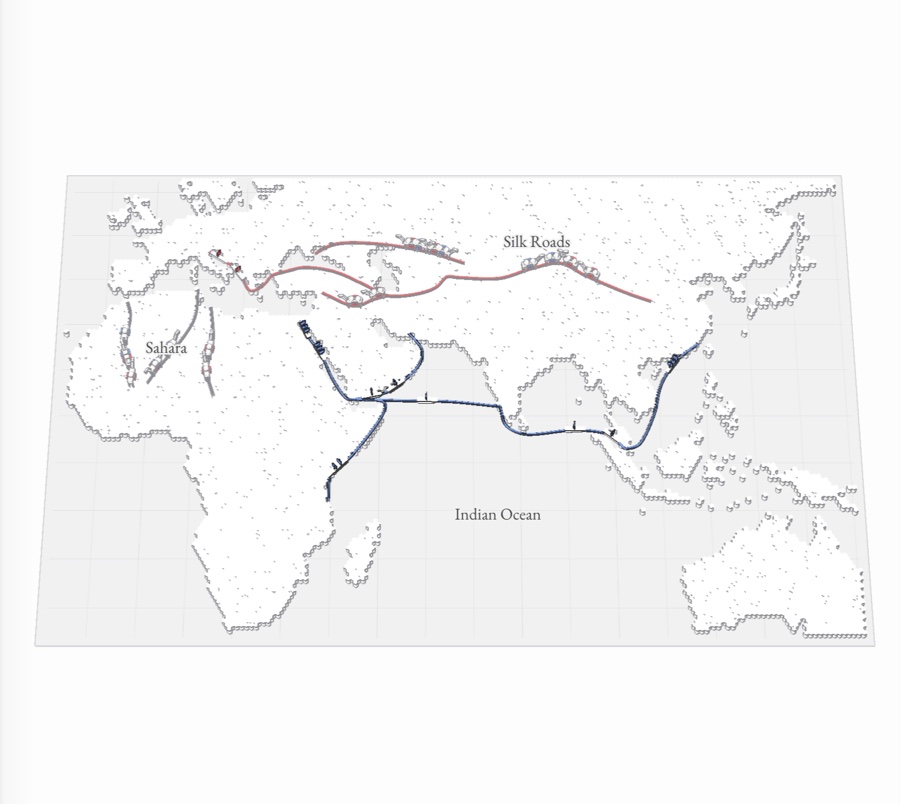
A paper-relief map of Africa, Europe and Asia with the Silk Roads in red, the Indian Ocean sea lanes in blue and the trans-Saharan caravan routes in gray, camels and ships moving along them
No. 125 pages

Land-based empires

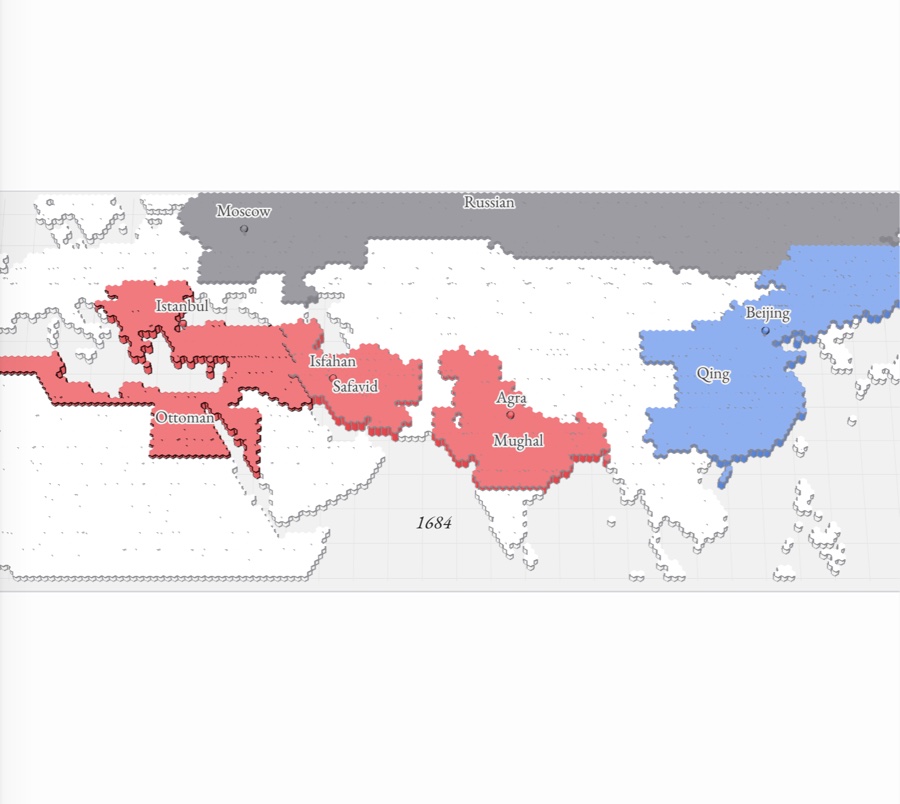
The Ottoman, Safavid and Mughal empires in red, the Qing in blue and Russia in gray across a paper-relief map of Afro-Eurasia around 1684, with pins at Istanbul, Isfahan, Agra, Beijing and Moscow
No. 139 pages

Transoceanic interconnections
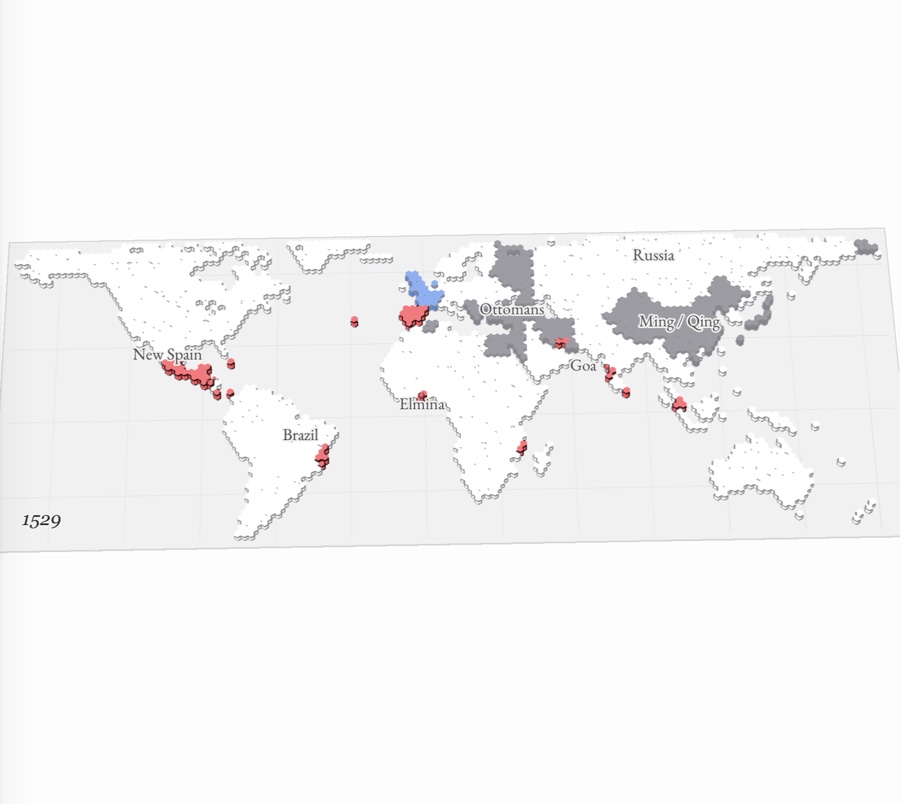
A world map in paper relief, about 1530: Spain and Portugal’s American conquests and Indian Ocean ports in red, the Ottoman and Ming empires in gray, northwestern Europe in blue
No. 1411 pages

Revolutions

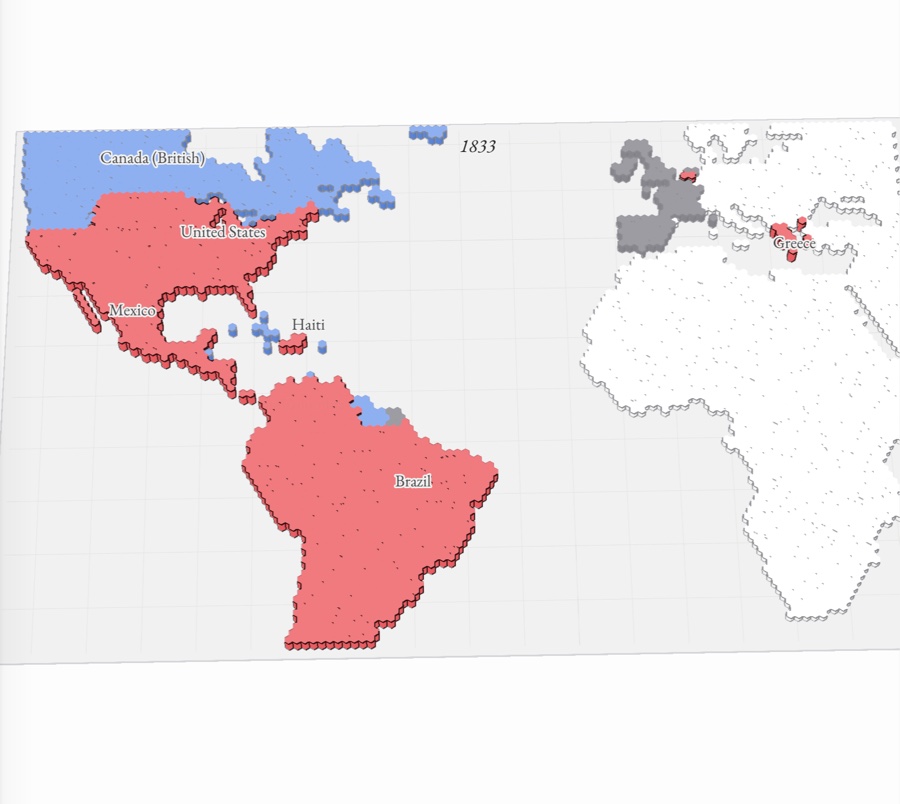
A paper-relief map of the Atlantic world in 1833: the United States, Mexico, Haiti, Brazil and Spanish South America raised in red as independent nations, Canada and the Guianas still blue colonies, and Britain, France, Spain and Portugal in gray, with Greece newly red
No. 159 pages

Consequences of industrialization
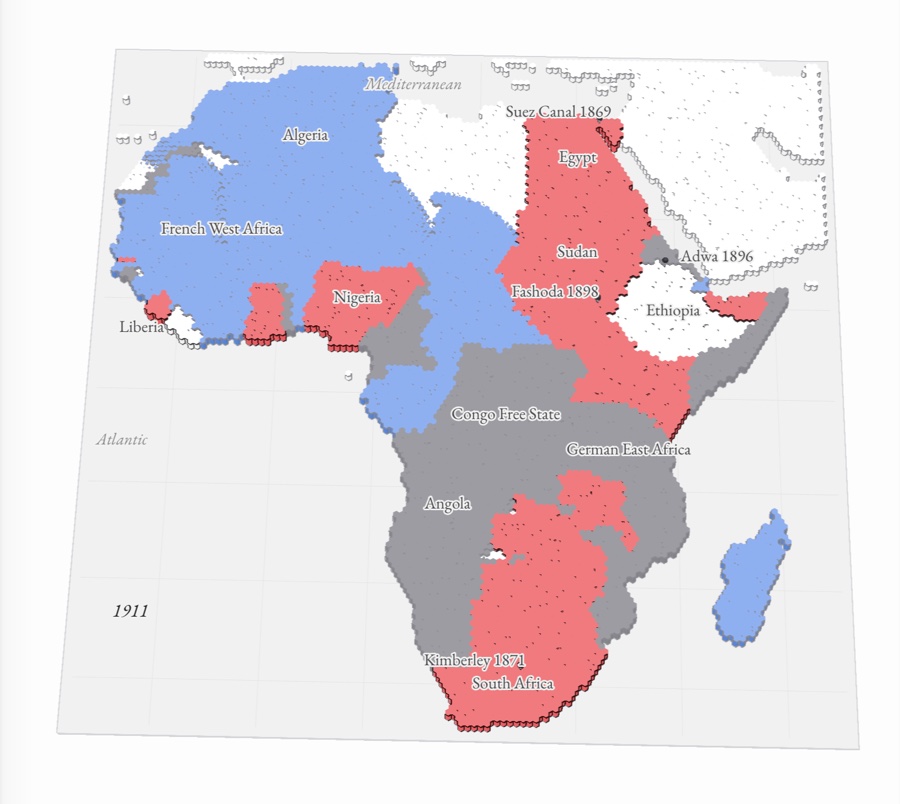
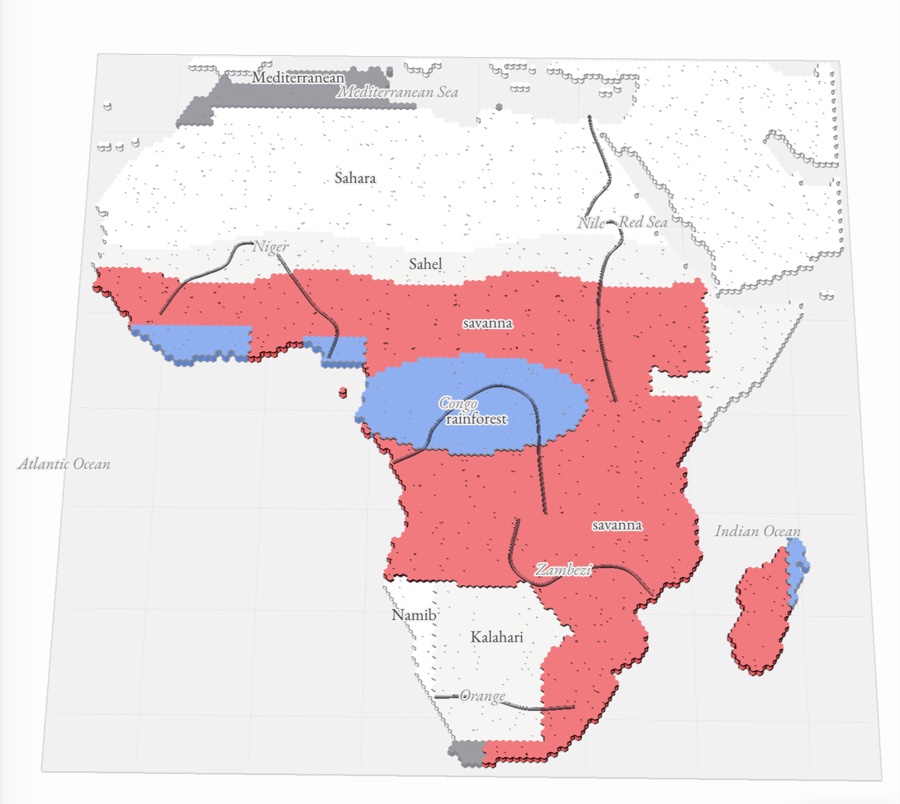
Africa in 1911 as paper relief: British colonies red from Egypt to the Cape, French blue across the north and west, the other powers gray, with Ethiopia and Liberia still independent
No. 1610 pages

Global conflict

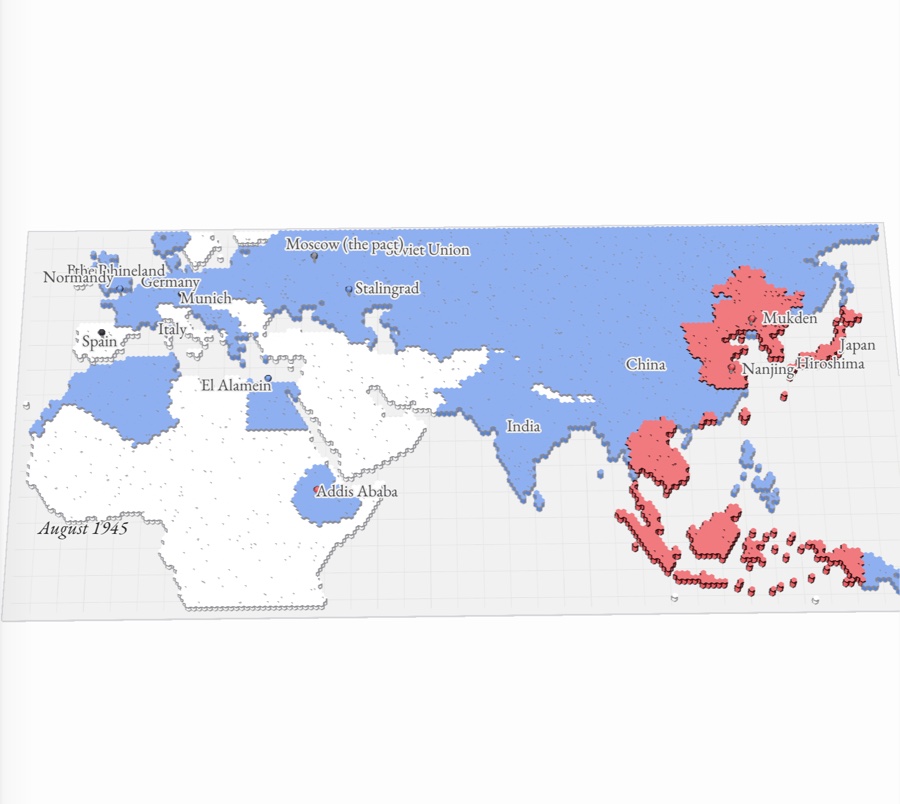
A map of Europe, Africa and Asia in August 1945: the last Axis-held lands in red across Japan, Korea, eastern China and Southeast Asia, Allied territory in blue, with pins at Munich, Stalingrad, El Alamein, Normandy and Hiroshima
No. 1710 pages

Cold War and decolonization
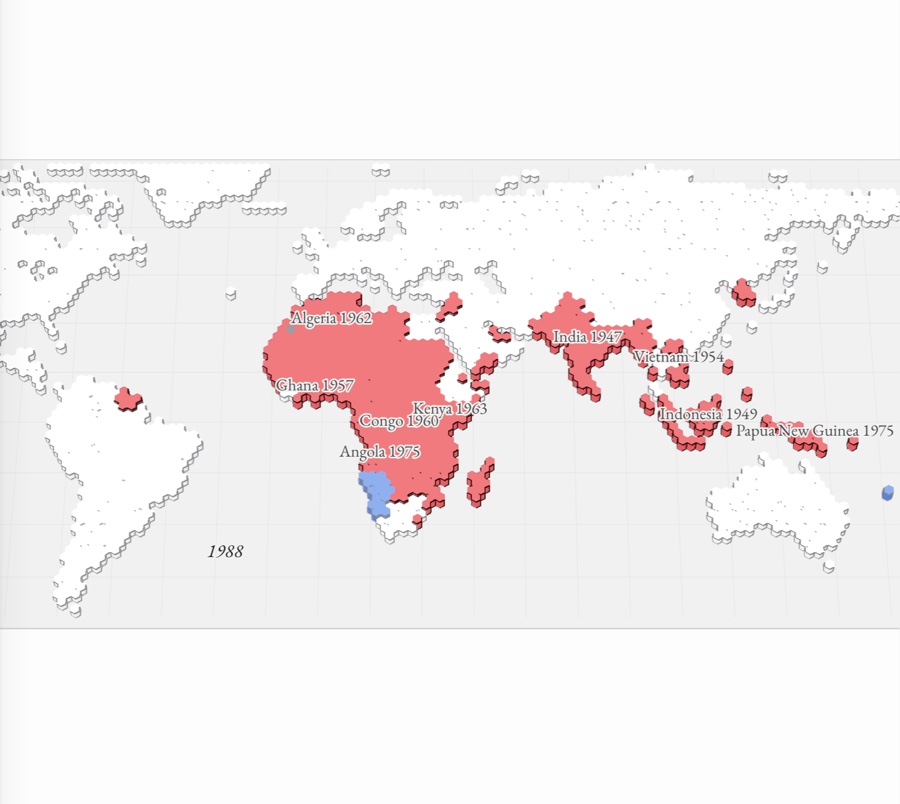
A paper-relief world map in 1988: nearly all of Africa, South Asia and Southeast Asia raised in red as independent states, each labeled with its year (India 1947, Indonesia 1949, Ghana 1957, Algeria 1962, Angola 1975), with Namibia still in blue as the last colony
No. 1810 pages

Globalization

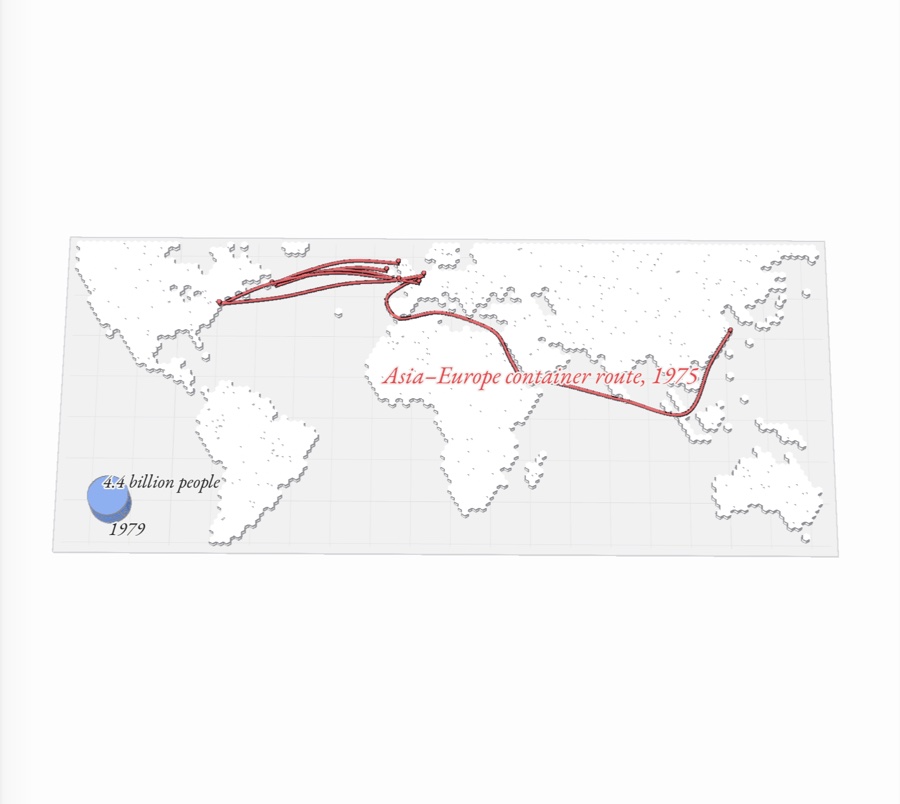
A paper-relief world map with red routes joining the continents: the transatlantic links of radio, flight, cable and jets, and the container route from East Asia to Europe through Suez, and a blue disc for the world’s billions of people

Human Geography

AP Human Geography

No. 018 pages

Thinking geographically

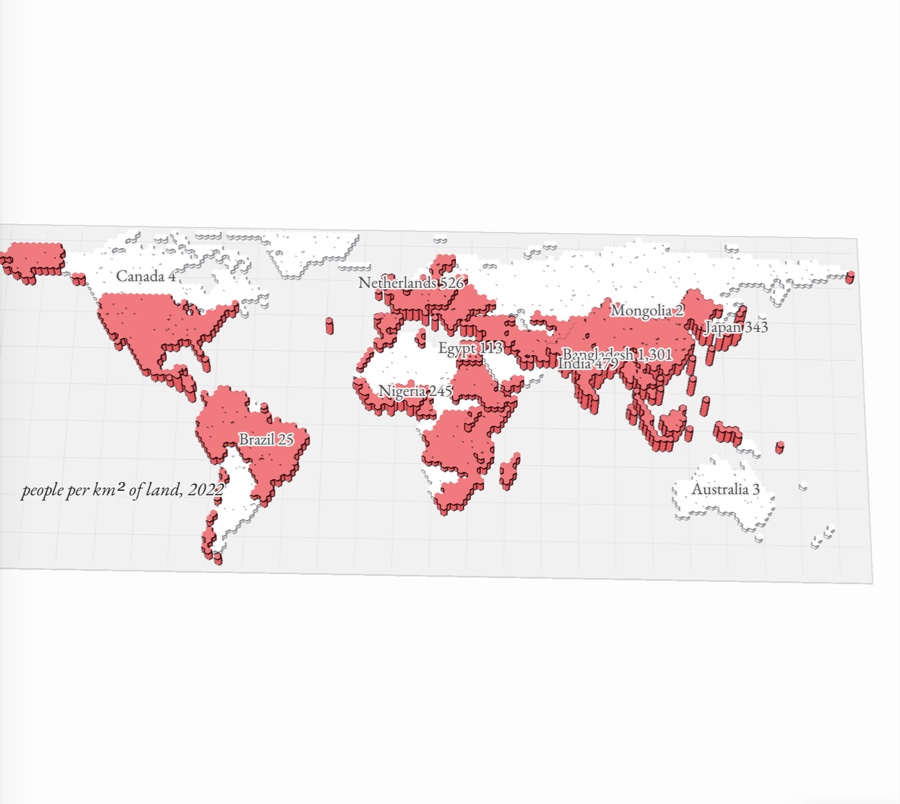
The world’s countries raised by population density, from the near-empty north and deserts to the crowded plains of South and East Asia
No. 0213 pages

Population and migration
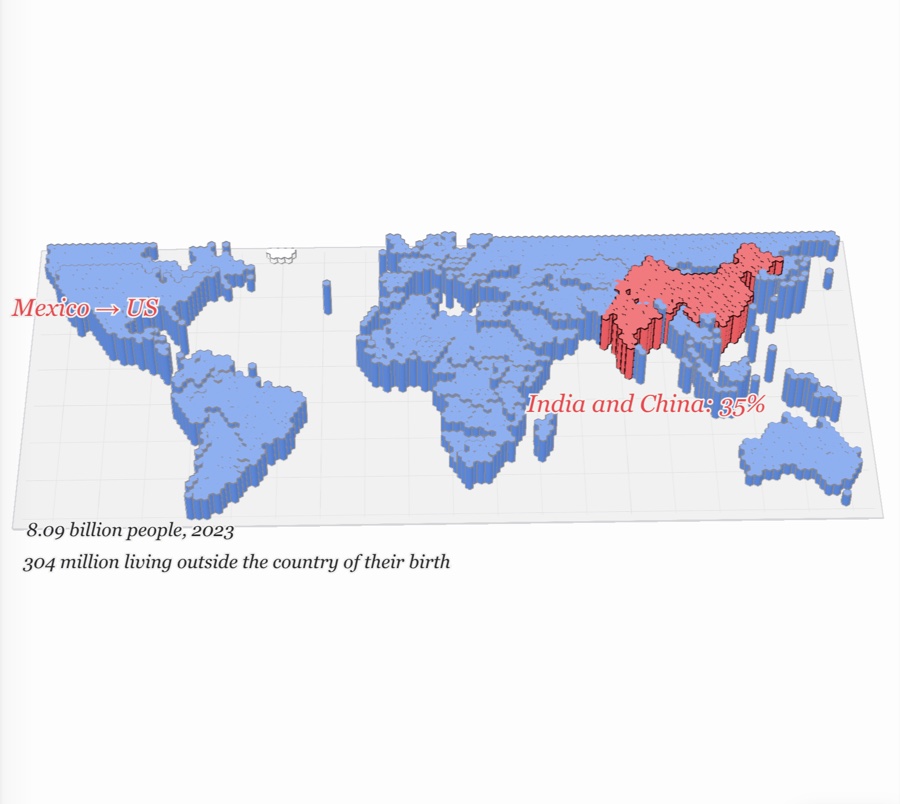
The world as paper relief, each country raised by its population density, with India and China in red and migrants walking the Mexico–US corridor
No. 039 pages

Cultural patterns and processes
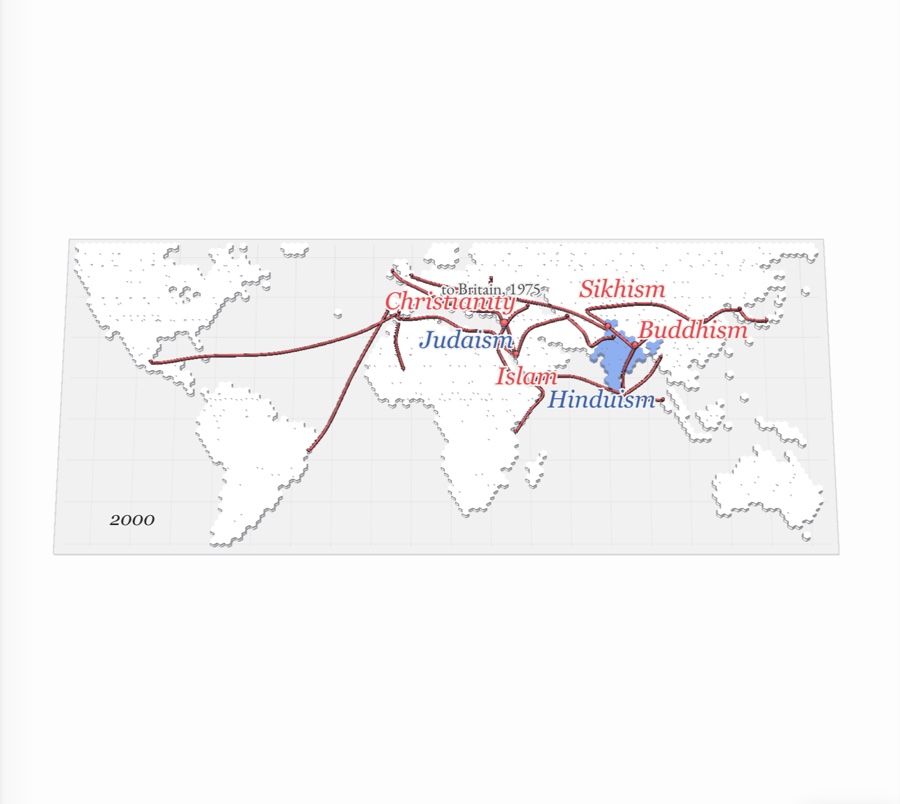
A world map of the hearths of the major religions, with the paths of Buddhism, Christianity, Islam and Sikhism spreading out from them and the ethnic religions, Hinduism and Judaism, staying near home
No. 0411 pages

Political patterns and processes
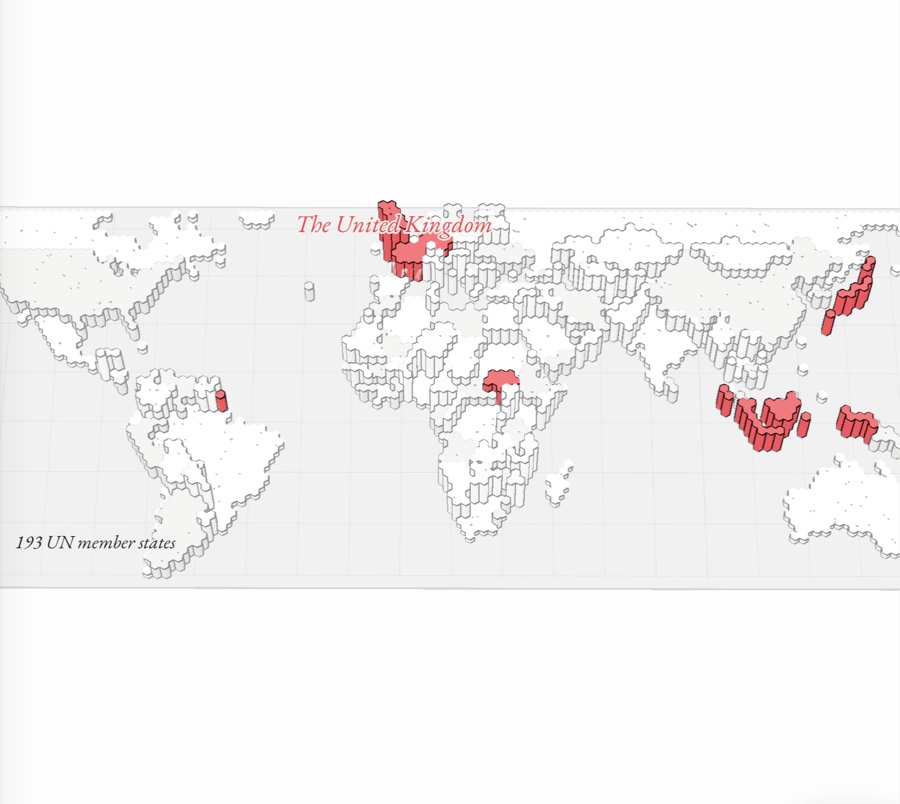
A political map of the world raised in paper relief, every boundary inked, with the United Kingdom, France, Germany, Japan, Indonesia and South Sudan picked out in red
No. 0513 pages

Agriculture and rural land use
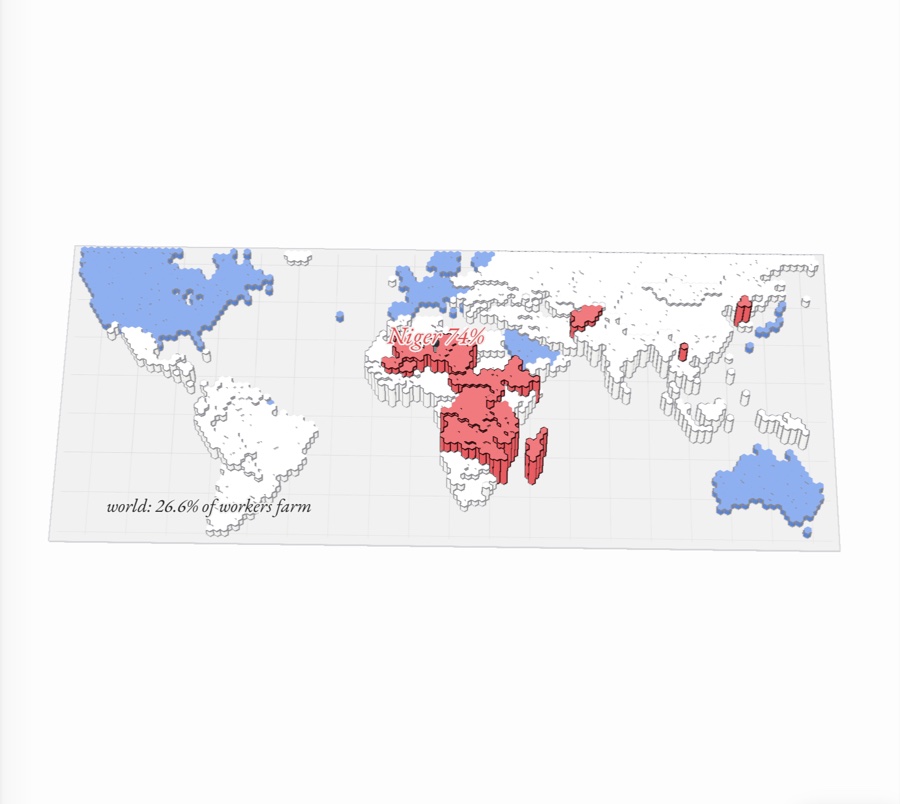
A paper-relief world map with each country raised by the share of its workers in agriculture, sub-Saharan Africa standing tall in red, the rich world flat in blue, and a pin reading Niger 74%
No. 0612 pages

Cities and urban land use
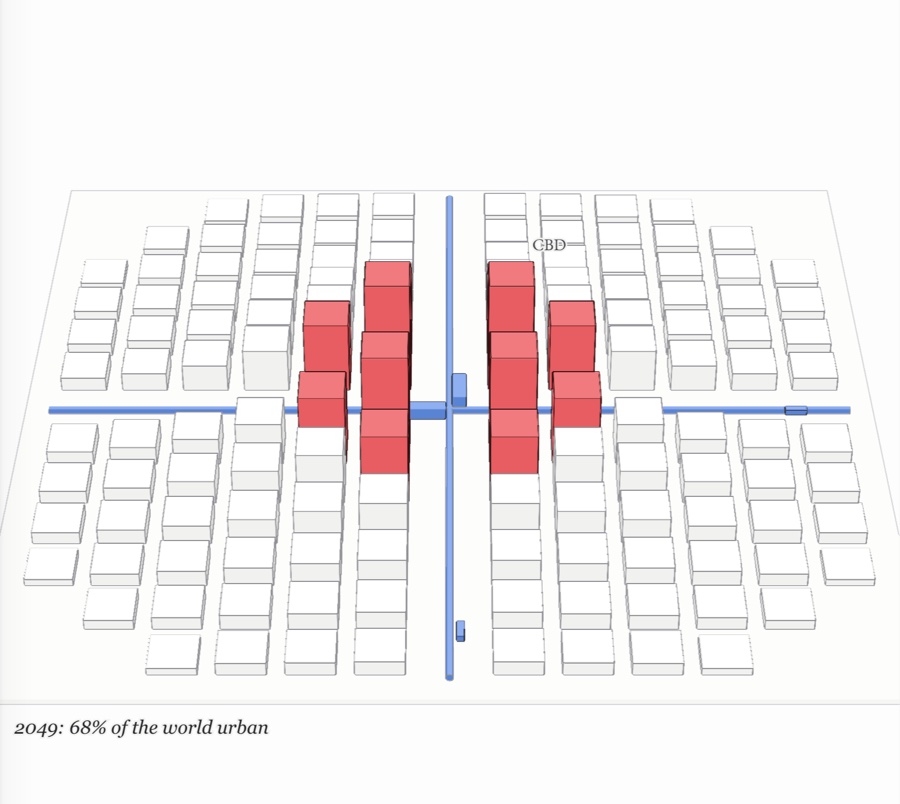
A hypothetical city of paper blocks crossed by two blue rail lines, its red central business district standing tallest at the center
No. 079 pages

Industrial and economic development
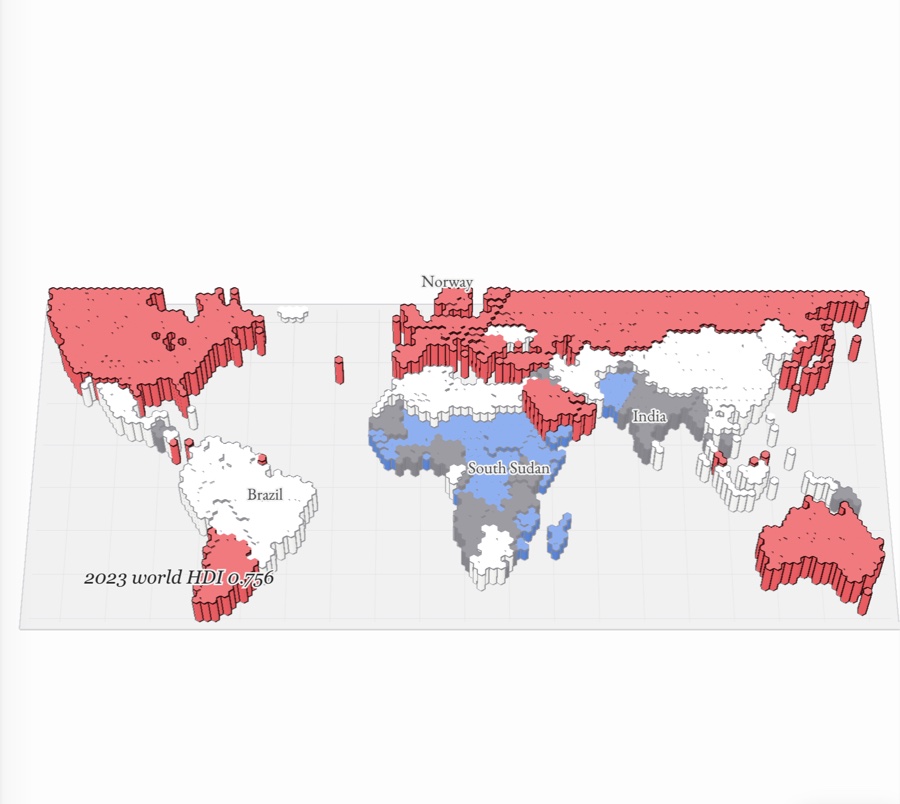
Every country on a paper world map raised to its Human Development Index in 2023, the very high ones standing red across North America, Europe and Australia and the low ones blue, most of them in Africa

Government

AP US Government and Politics

No. 0115 pages

Foundations of American democracy

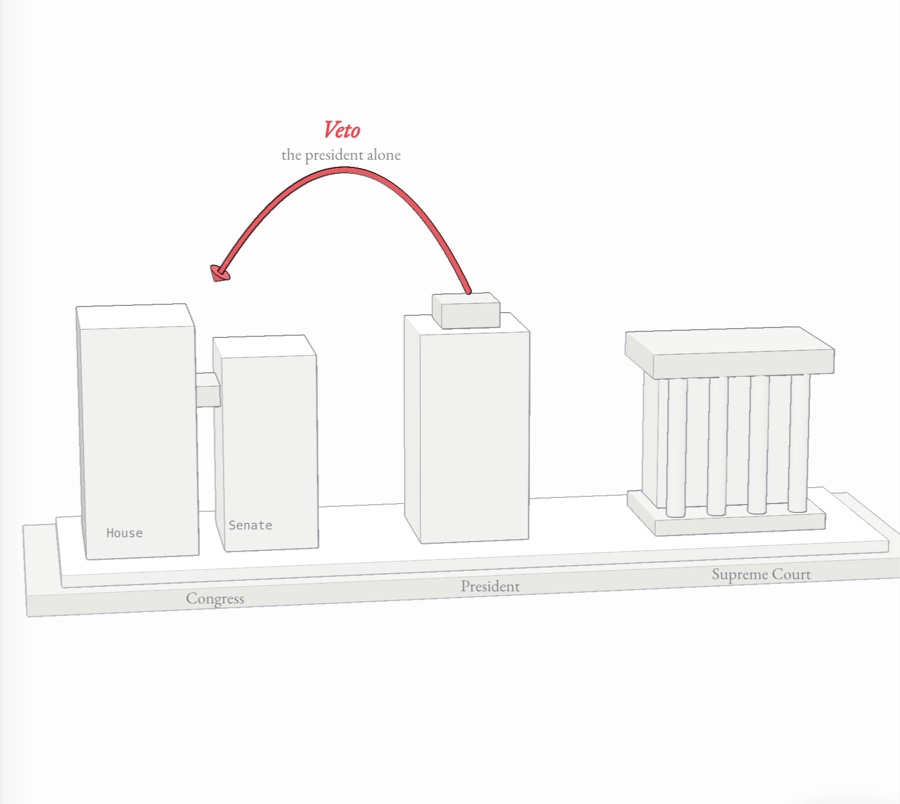
Congress, the president and the Supreme Court as paper towers on the Constitution, a red veto arcing from the president back to Congress
No. 0219 pages

Interactions among branches of government
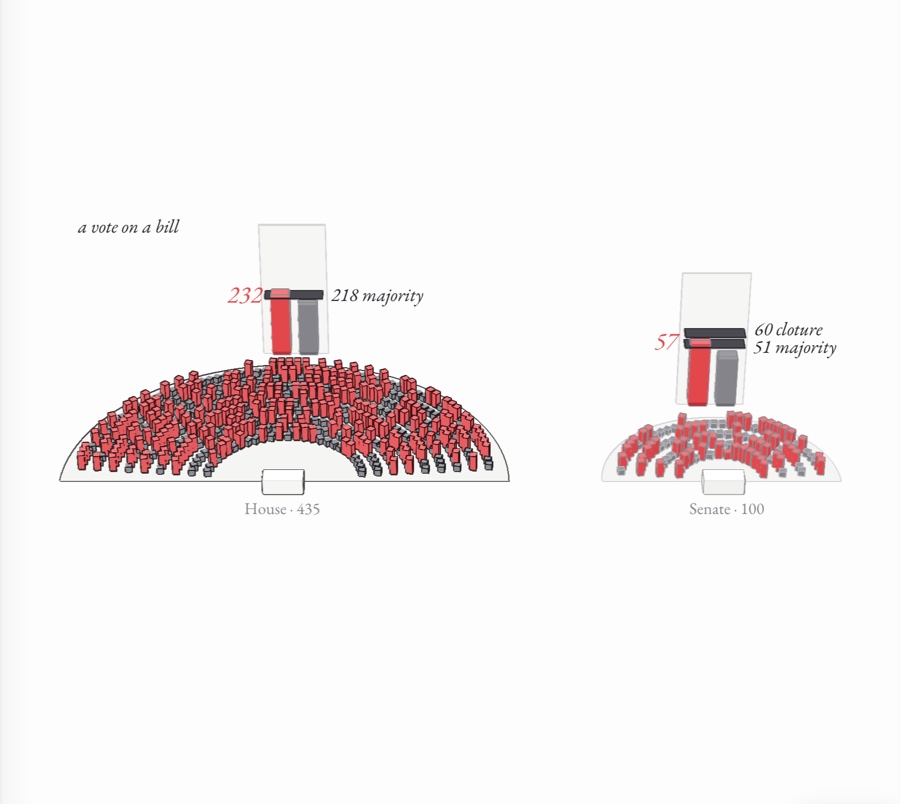
The House of Representatives’ 435 seats and the Senate’s 100 as hemicycles, yea seats standing red and nays gray, each with a tally board showing 232 yeas past the 218 majority and 57 yeas short of the 60 needed for cloture
No. 0317 pages

Civil liberties and civil rights
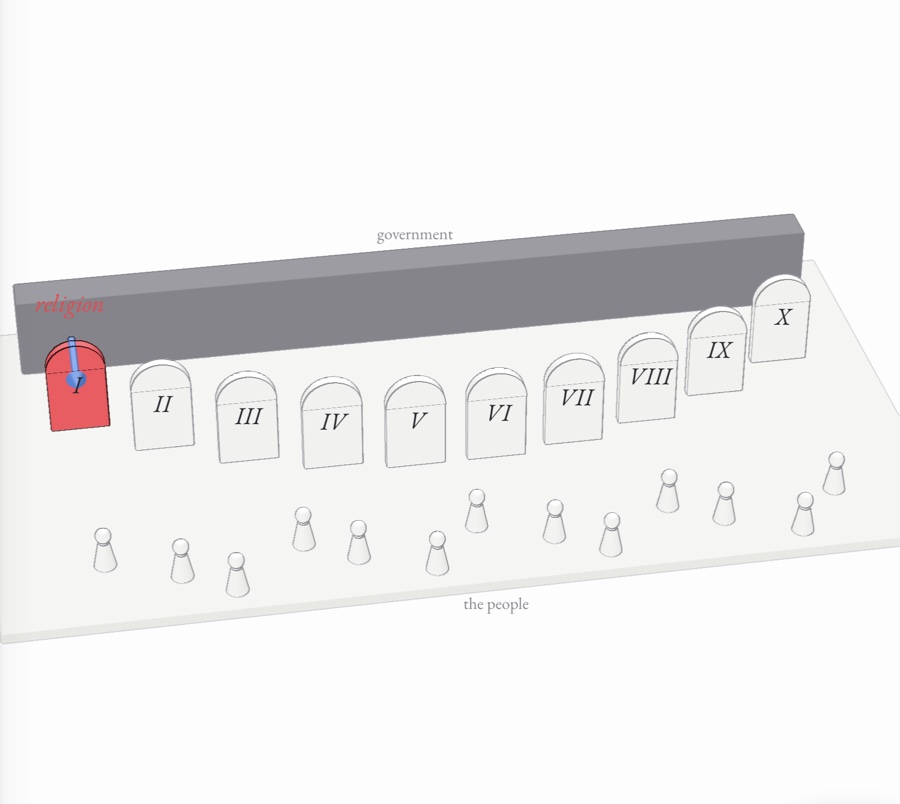
Ten paper tablets of the Bill of Rights standing between a gray block of government and a crowd of pawns, the First Amendment’s tablet red where a blue push from government meets it
No. 0415 pages

American political ideologies and beliefs
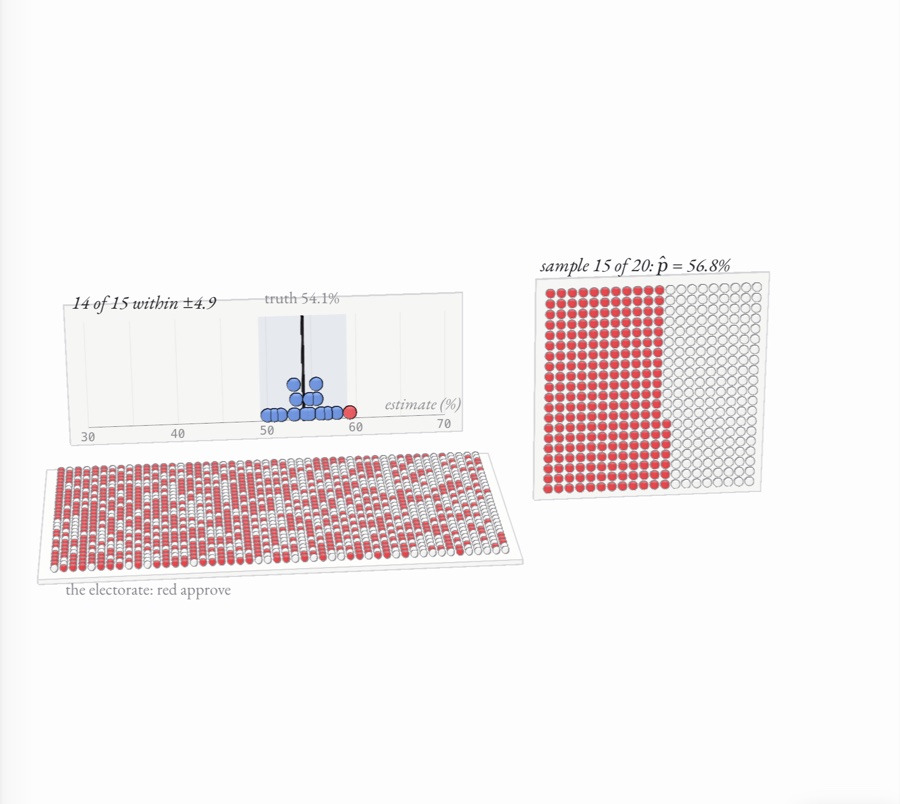
A hypothetical electorate of 1,500 voter balls on a floor, red for approve, with a random sample of 400 sorted into a tray beside it and a dot plot of the samples’ estimates piling up inside a blue margin-of-error band around the true 54.1%, one red dot just outside
No. 0517 pages

Political participation
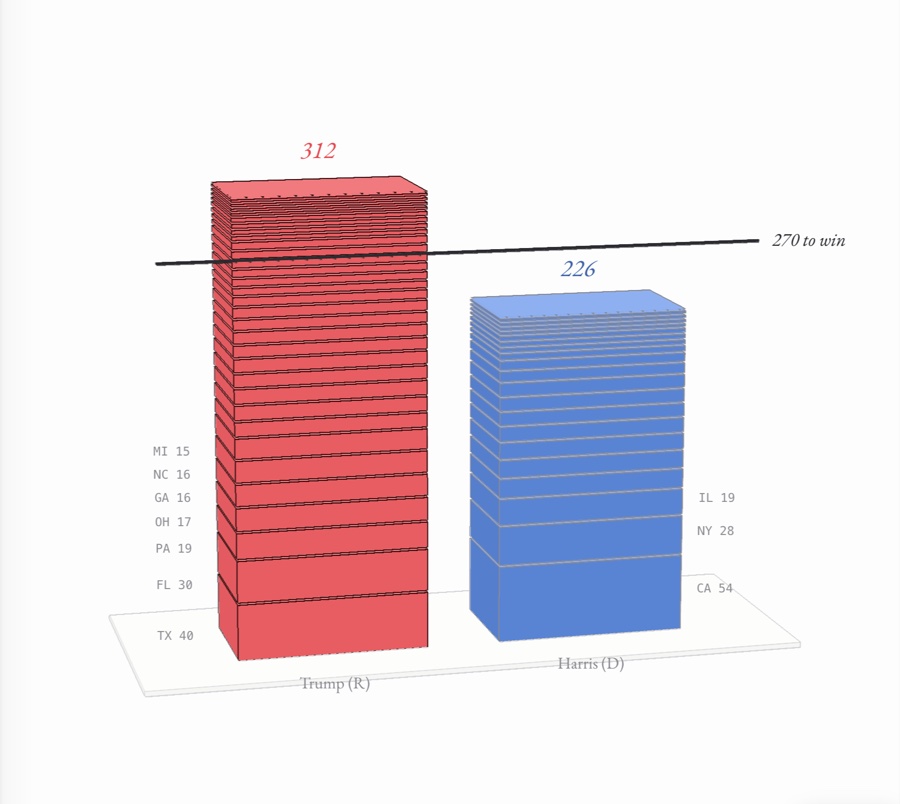
The 2024 Electoral College as two stacks of state slabs, red rising past a 270-to-win line to 312 and blue reaching 226, the largest states labeled

Economics

AP Macroeconomics

No. 0114 pages

Basic economic concepts

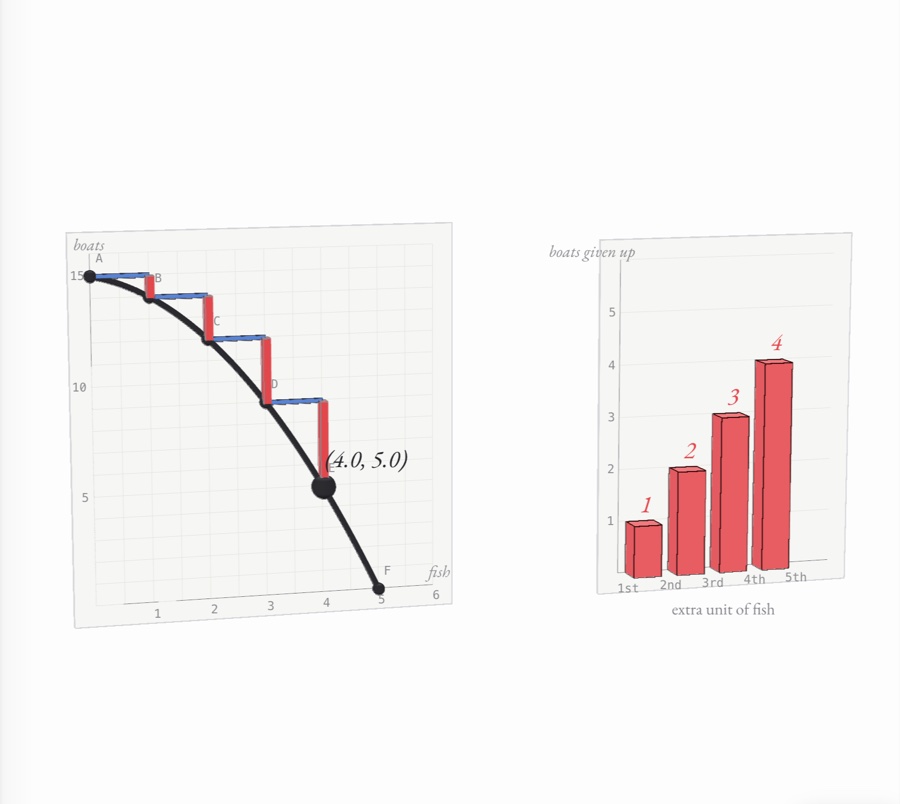
A bowed production possibilities curve for fish and boats on graph paper, a point walking down it in steps of blue (one more unit of fish) and red (boats given up), beside rising red bars of the opportunity cost of each extra unit of fish
No. 0212 pages

Economic indicators and the business cycle
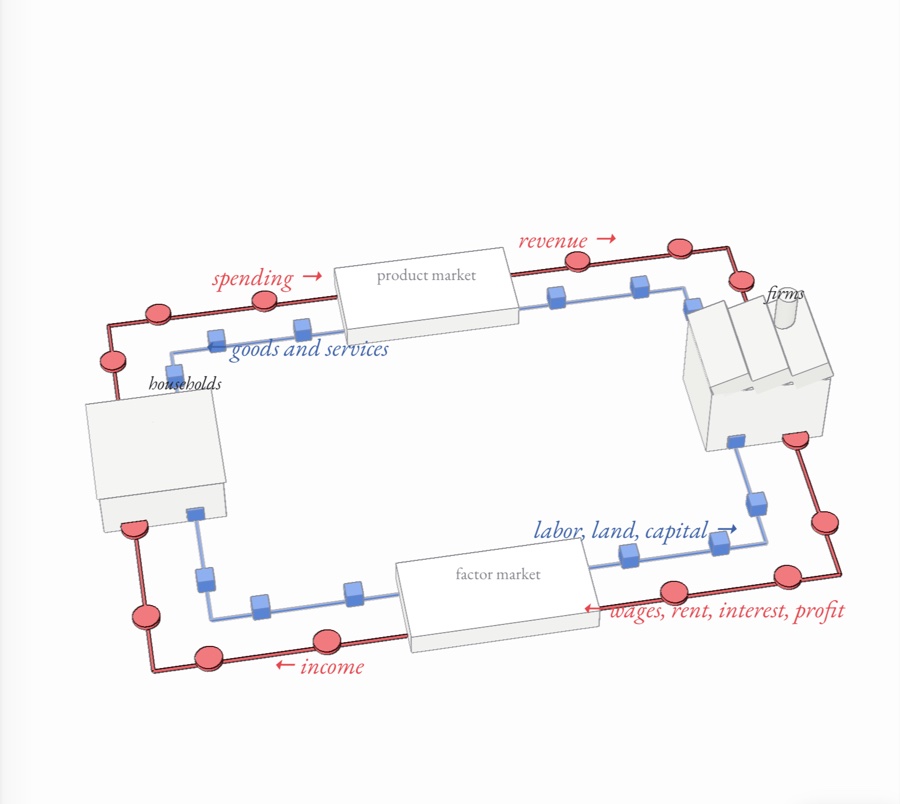
A circular flow seen from above: red coins of spending and income circle between households and firms through the product and factor markets, while blue goods and factors circle the other way
No. 0314 pages

National income and price determination
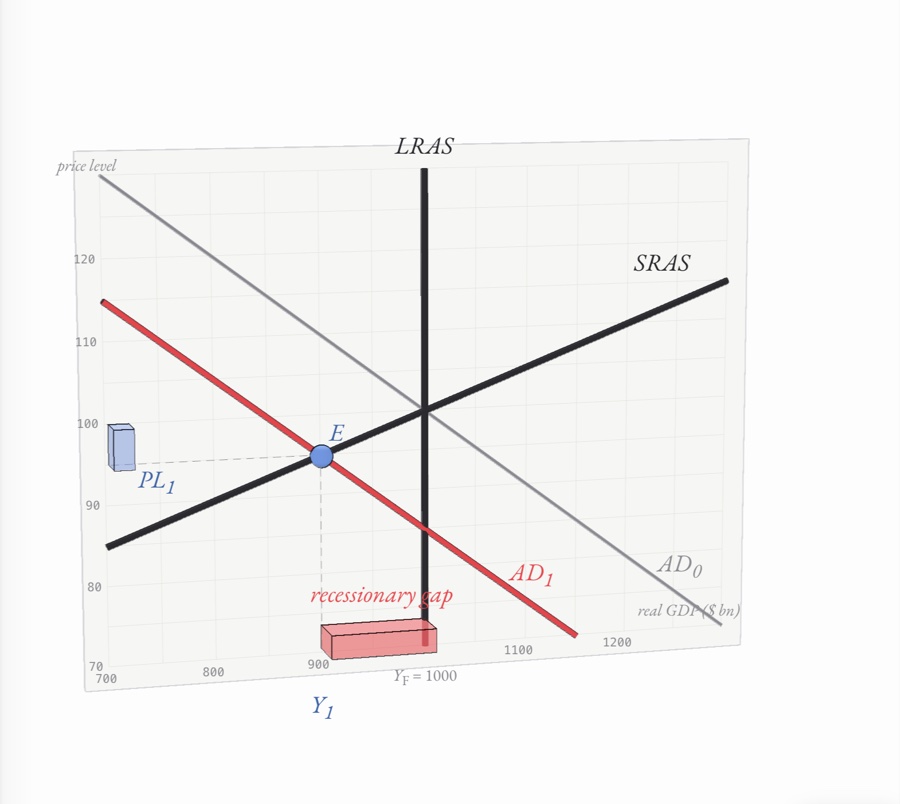
Aggregate demand shifted left on an AD–AS graph, its equilibrium dot sliding down short-run aggregate supply, and the recessionary gap to the vertical LRAS rising from the paper as a red slab
No. 0413 pages

The financial sector

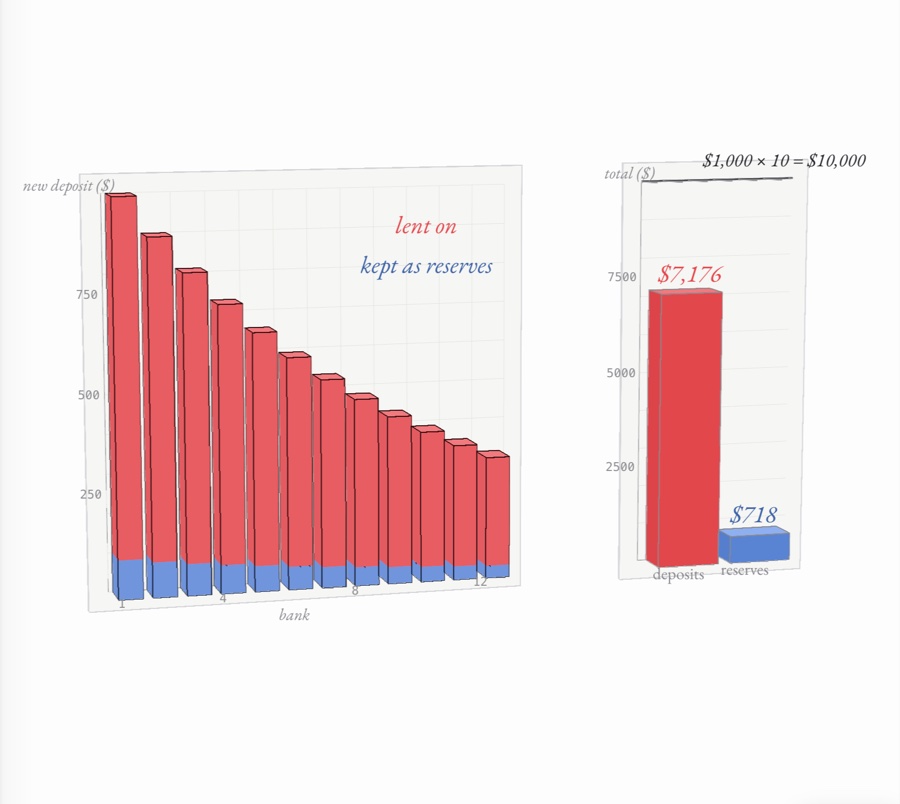
Twelve bank deposits standing in a row, each red bar of new money 90% of the one before above a blue sliver of reserves kept, beside two columns adding them up toward a $10,000 limit and $1,000 of reserves
No. 0513 pages

Long-run consequences of stabilization policies
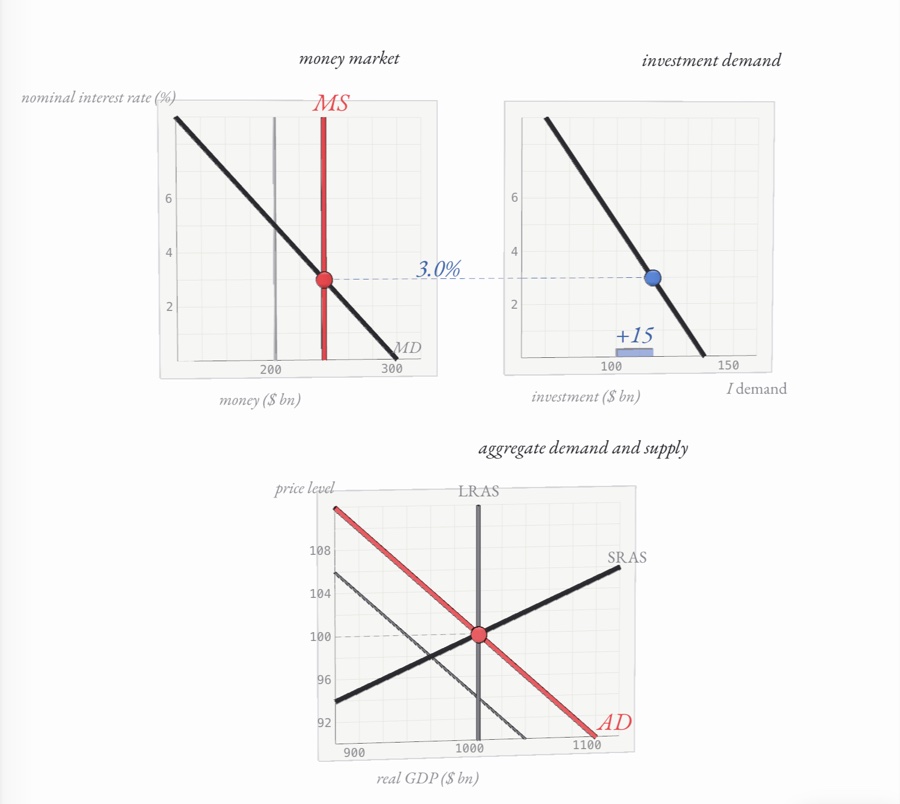
Linked graphs on paper boards: the money supply shifted right in the money market, the lower interest rate carried across to higher investment, and aggregate demand moved right to close a recessionary gap at full-employment output
No. 0616 pages

Open economy: international trade and finance
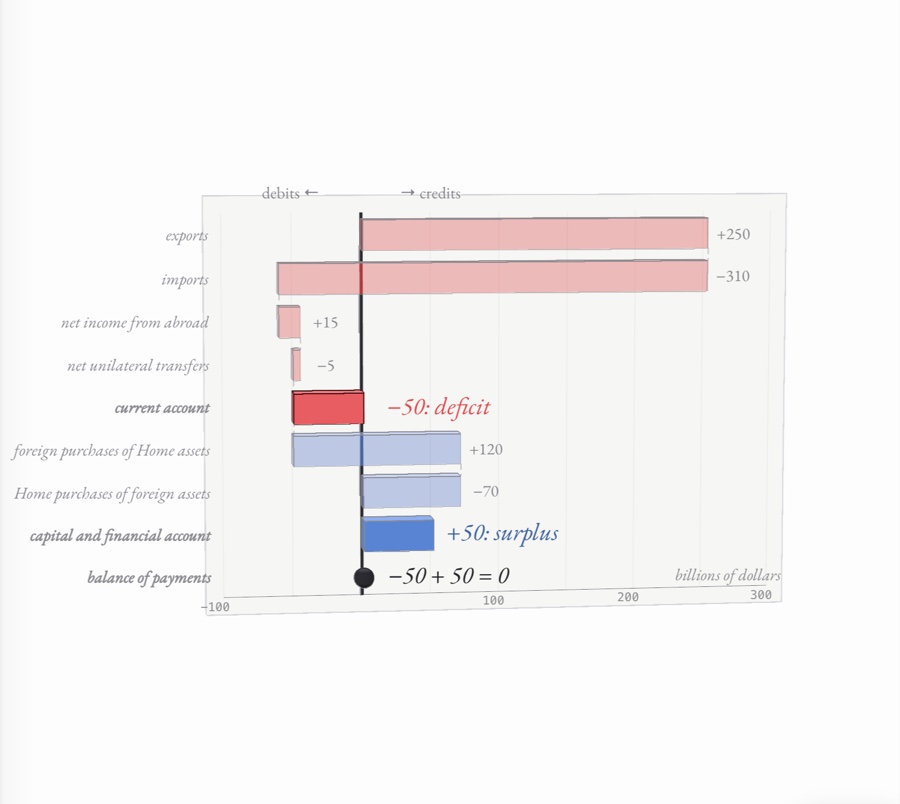
A hypothetical country’s balance of payments as a ledger: credits and debits stand as blocks around a zero line, a red current-account deficit of −50 matched by a blue capital and financial account surplus of +50, summing to zero

AP Microeconomics

No. 0716 pages

Basic economic concepts
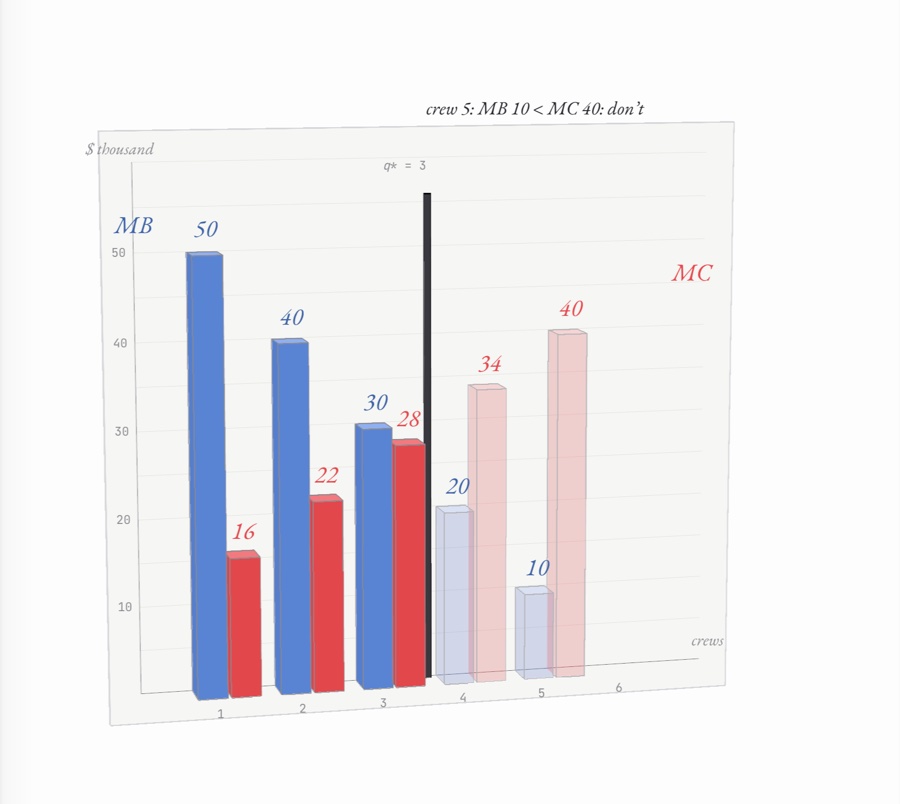
Blue bars of marginal benefit falling and red bars of marginal cost rising, crew by crew, on graph paper, with a black line after the third crew where the next one would cost more than it adds
No. 0817 pages

Supply and demand

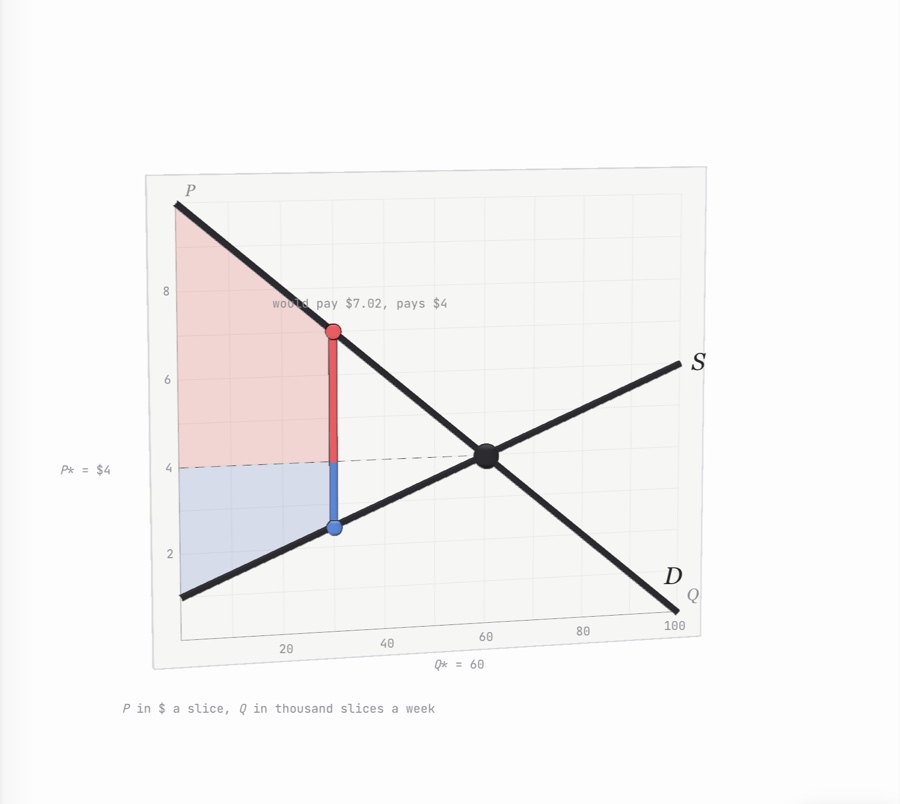
Demand and supply for pizza slices crossing at $4 and 60 thousand, with consumer surplus shaded red above the price and producer surplus blue below it, filling in slice by slice behind one buyer’s and one seller’s surplus line
No. 0915 pages

Production, cost, and the perfect competition model
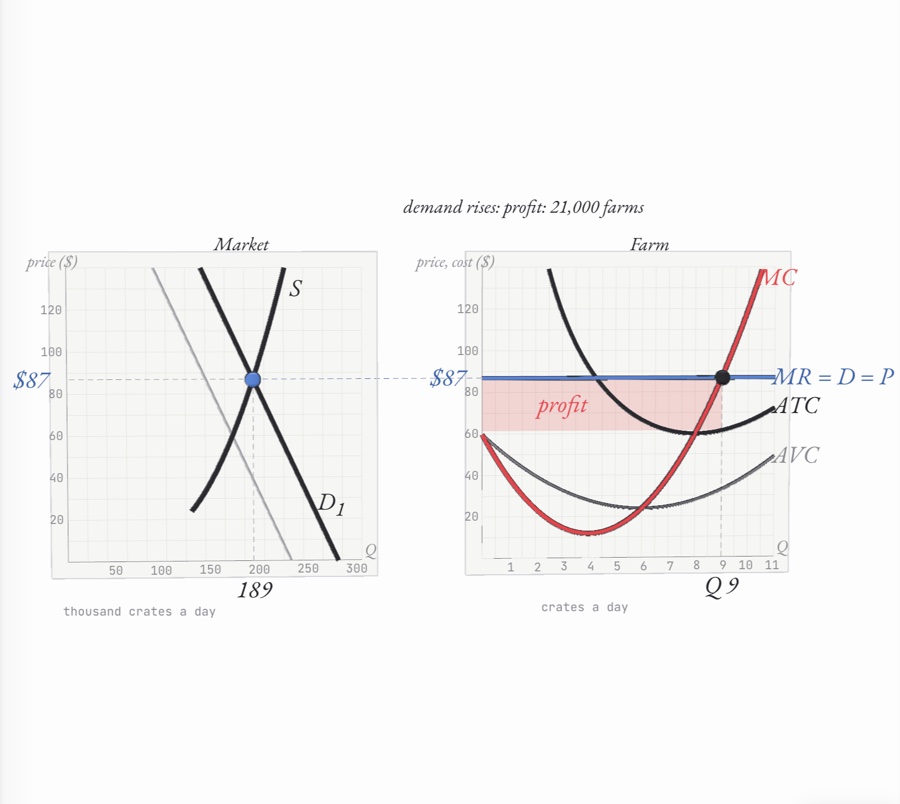
Side-by-side graphs of a strawberry market and one price-taking farm: demand has risen, the price of $87 carries across to the farm's horizontal MR = D line, and a red rectangle between price and ATC shows the farm's economic profit at the output where price meets marginal cost.
No. 1016 pages

Imperfect competition

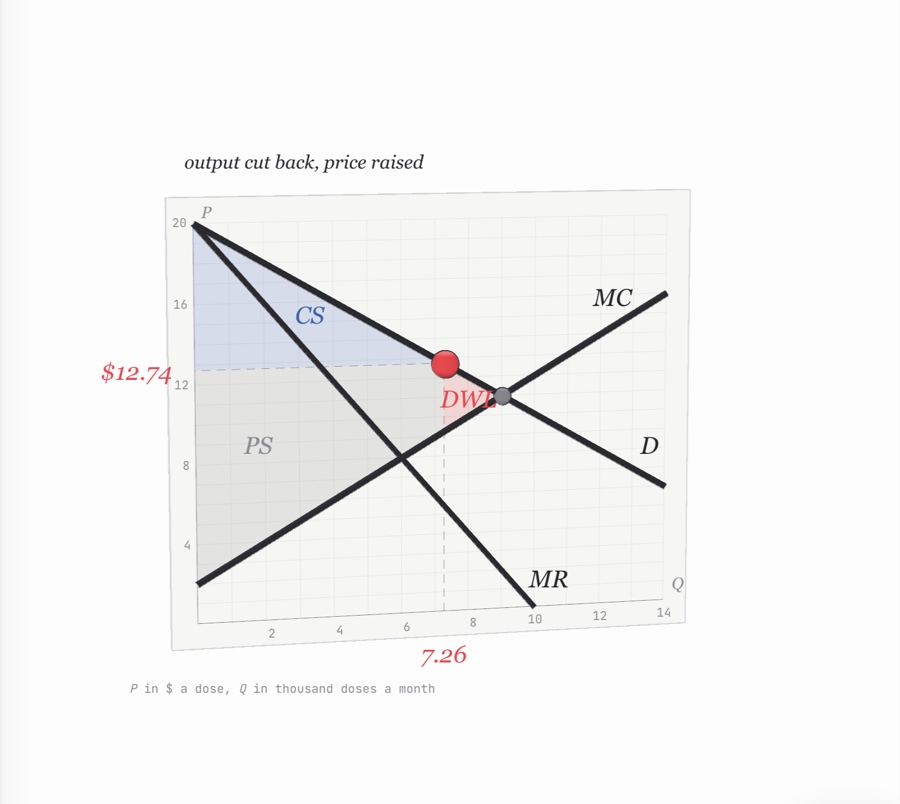
A monopoly graph with demand, marginal revenue and marginal cost: blue consumer surplus above the price, gray producer surplus, and a red deadweight-loss triangle between demand and marginal cost
No. 1115 pages

Factor markets

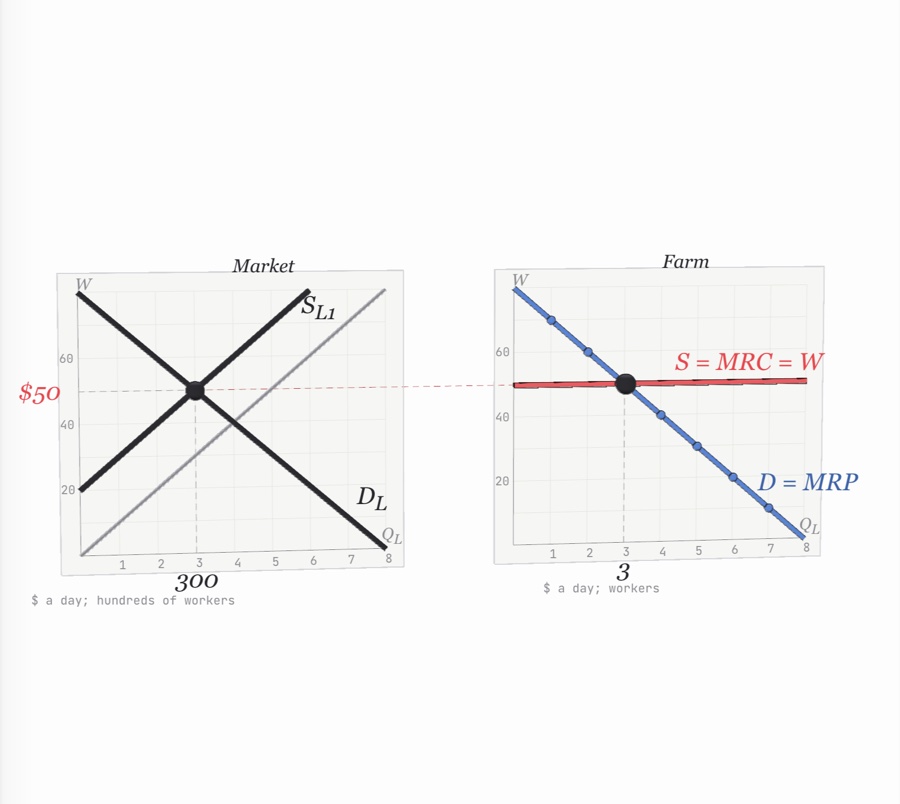
A labor market graph beside one farm’s graph: the market wage, carried across as the farm’s red horizontal line S = MRC = W, meets the farm’s blue marginal revenue product curve to set how many workers it hires, while market labor supply shifts and the wage and hiring follow
No. 1216 pages

Market failure and the role of government
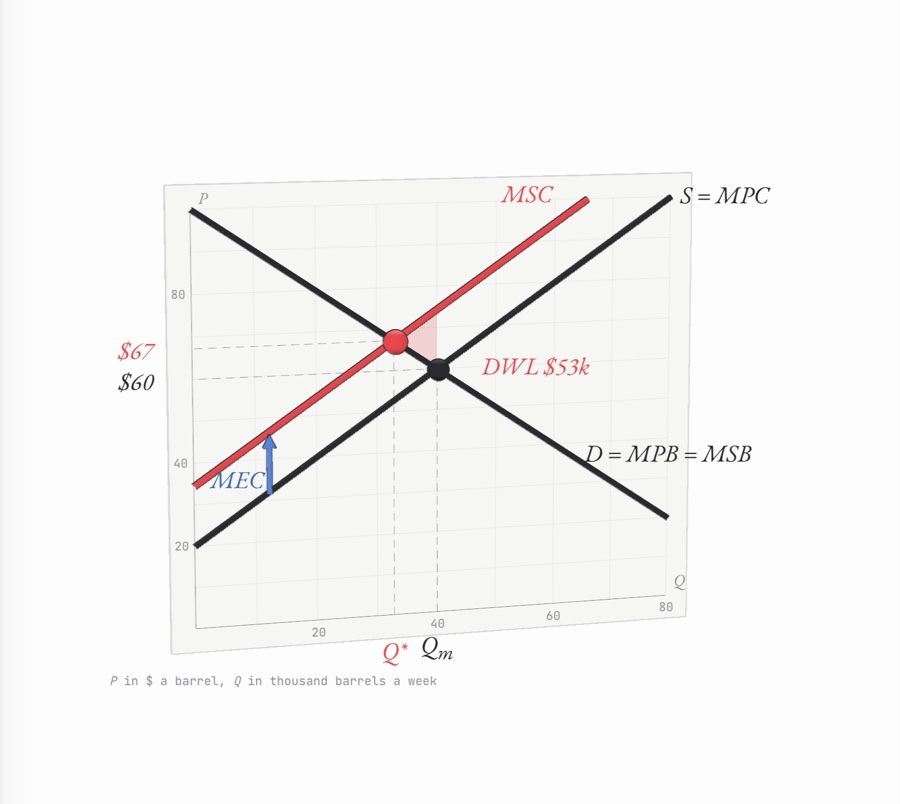
A market graph for a polluting chemical on graph paper: demand and supply crossing, a red marginal social cost curve above supply with a blue arrow for the external cost, and a red deadweight loss triangle between the social optimum and the market equilibrium

Psychology

AP Psychology

No. 0120 pages

Biological bases of behavior

A neuron in paper, its dendrites branching from the cell body and its myelinated axon carrying a red action potential toward the terminals, above the electrode’s voltage trace spiking from −70 mV past the −55 mV threshold
No. 0219 pages

Cognition

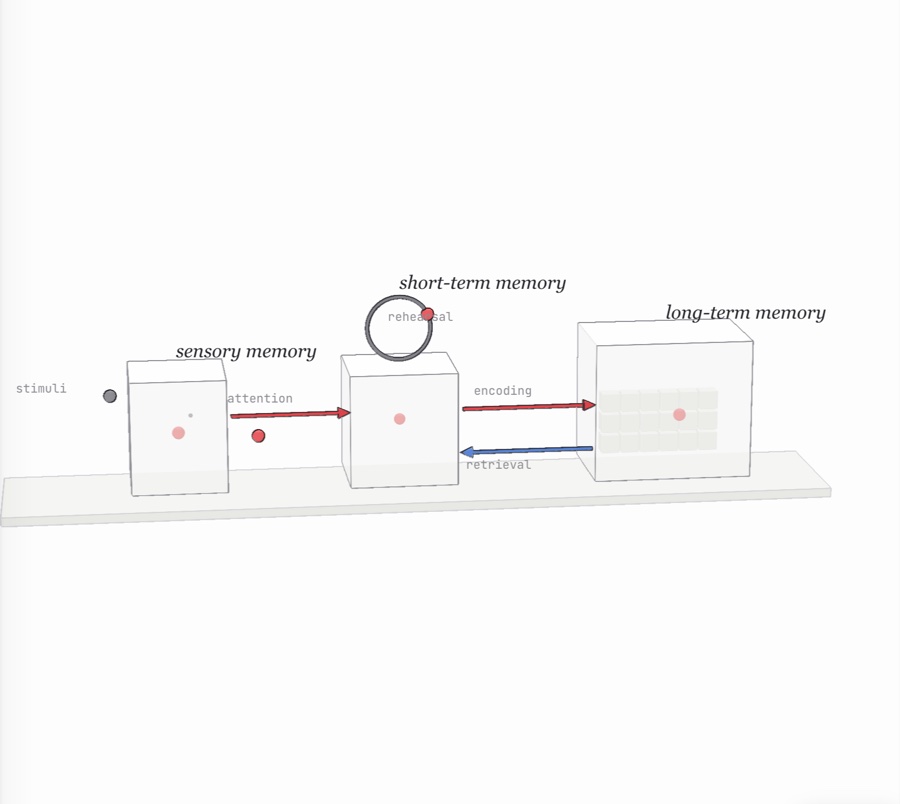
Stimuli flowing through sensory, short-term and long-term memory as paper boxes, with attention and encoding arrows, a rehearsal loop and retrieval flowing back
No. 0322 pages

Development and learning
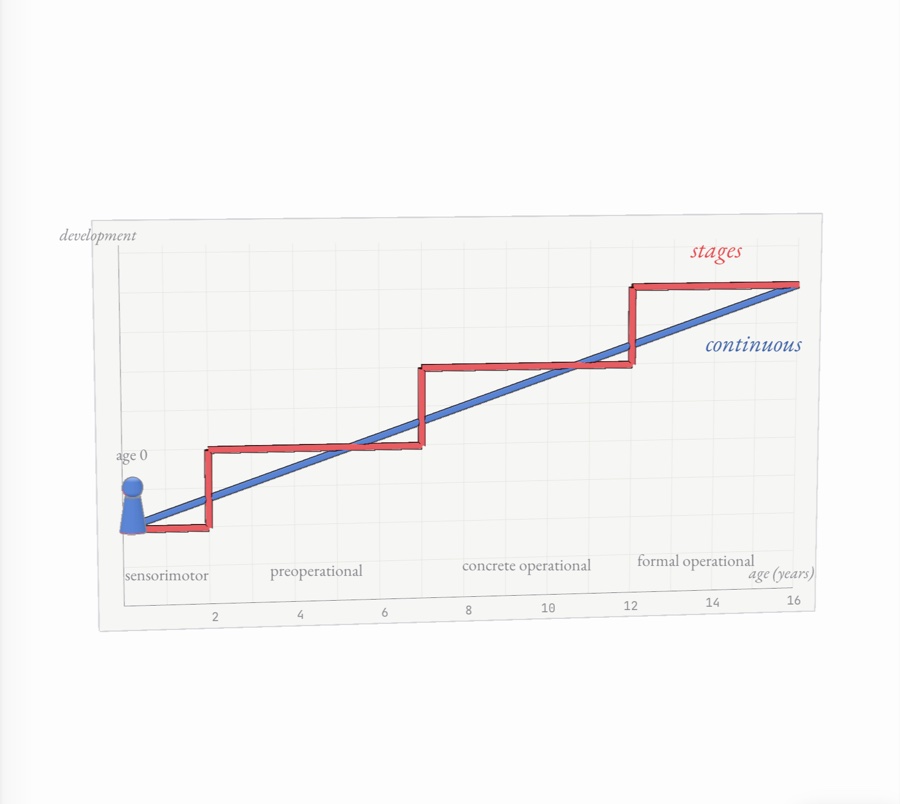
A child climbing a red staircase of Piaget’s four stages beside a blue ramp of continuous growth, on a graph of age from 0 to 16
No. 0419 pages

Social psychology and personality
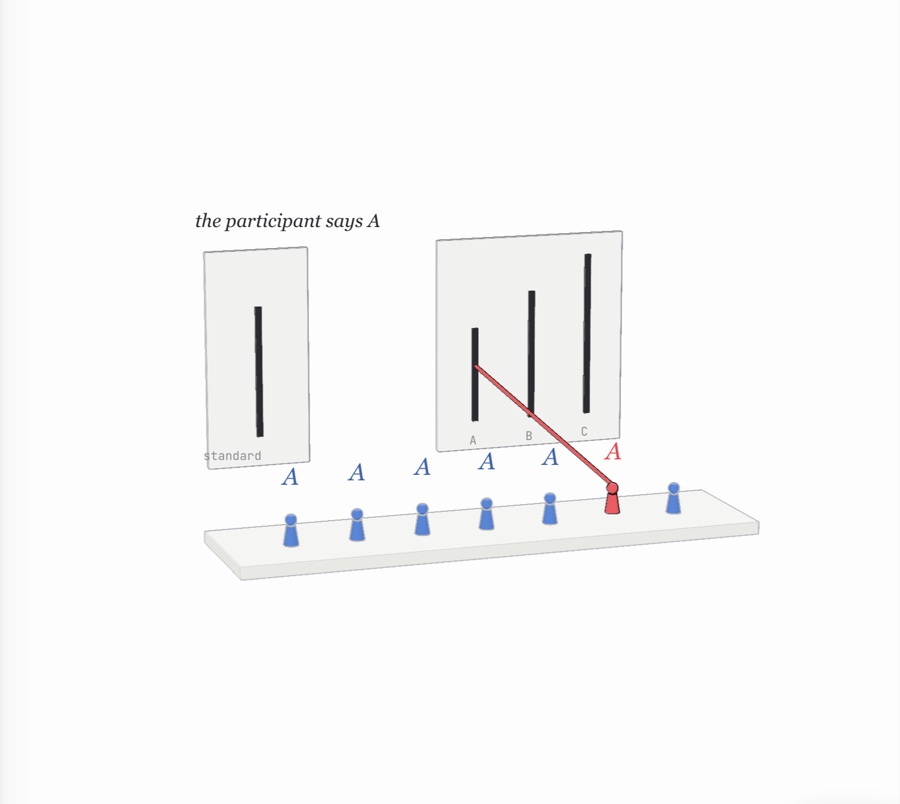
Seven pawns at a table judging lines in an Asch conformity study, six blue confederates each answering A, and the red participant drawing a line to the same wrong comparison line
No. 0518 pages

Mental and physical health
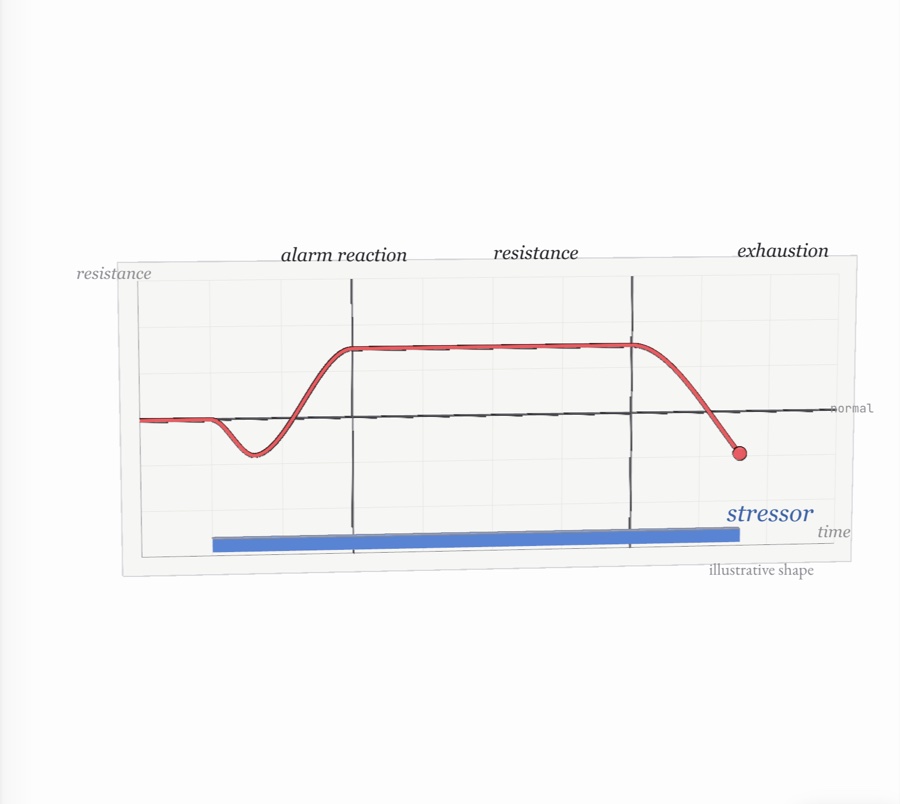
The general adaptation syndrome on graph paper: a red resistance curve dipping in the alarm reaction, holding above the normal line through resistance and falling into exhaustion as a blue stressor bar runs beneath it

Business

AP Business with Personal Finance

No. 0116 pages

Businesses, competition, and new ideas

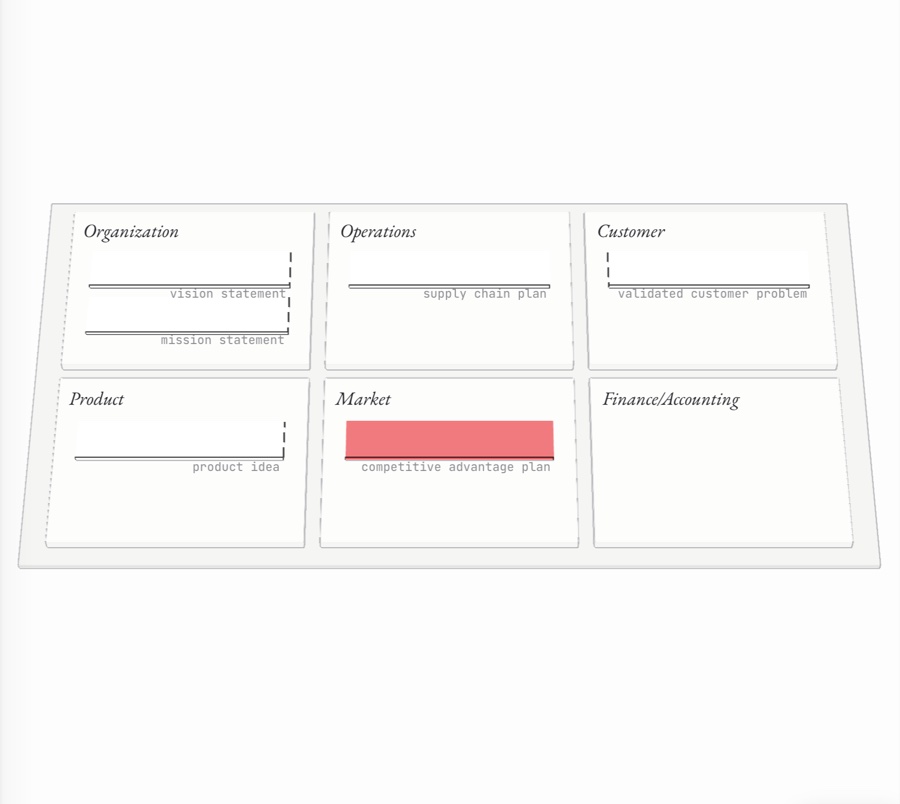
The Business Canvas as six paper tiles (organization, operations, customer, product, market, finance and accounting), with Unit 1’s deliverables laid on them one by one and the newest, the competitive advantage plan, lit red
No. 0217 pages

Marketing

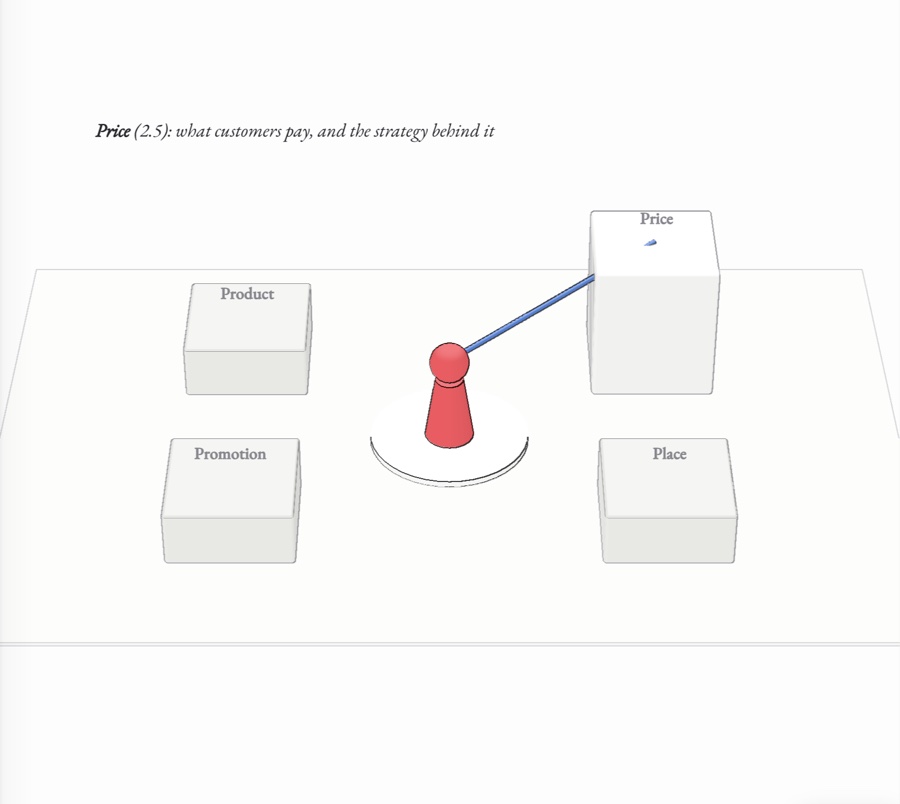
A red target customer stands on a disc at the centre of four plinths labelled product, price, place and promotion, one raised and linked to the customer by a blue line
No. 0318 pages

Personal saving and borrowing
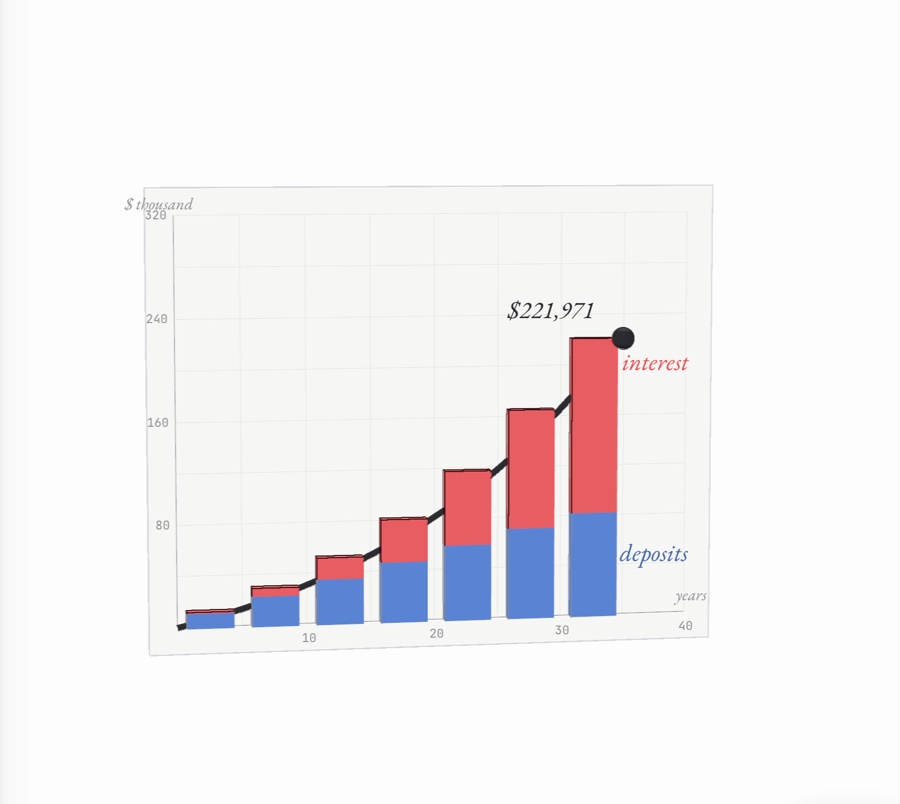
Bars of savings every five years for $200 a month at 5%, blue deposits under red interest that grows taller than the deposits, with an ink balance curve rising past $220,000 on graph paper
No. 0418 pages

Business finance and accounting
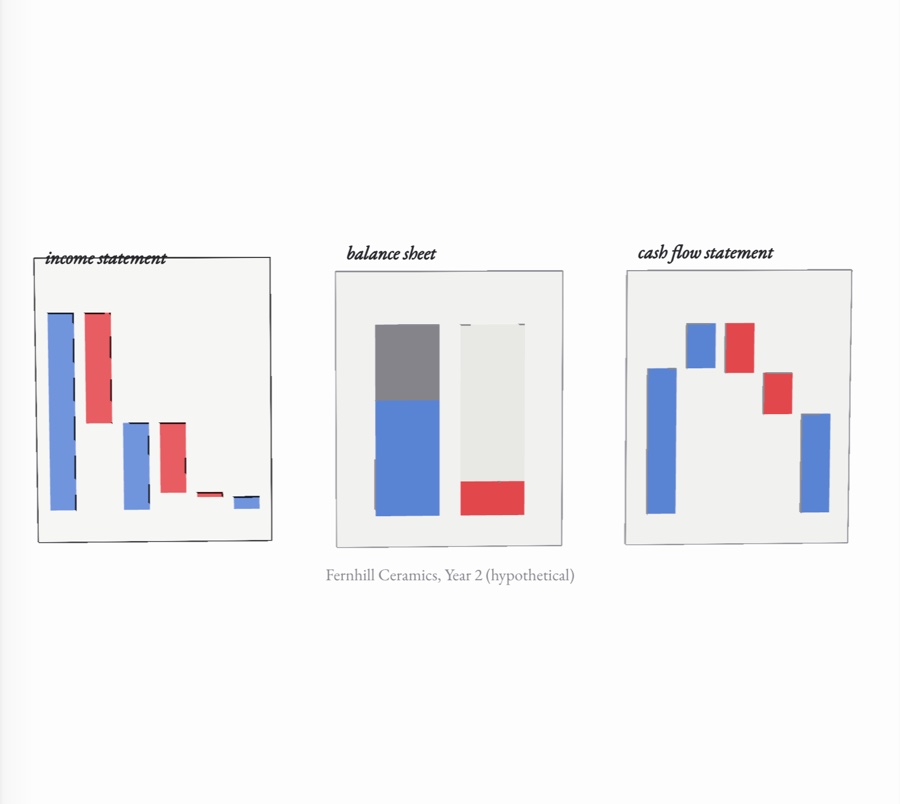
Three paper sheets for a hypothetical mug studio’s second year: an income statement as a falling waterfall of bars, a balance sheet’s two equal columns, and a cash flow statement bridging the opening to the closing cash
No. 0518 pages

Management and strategy
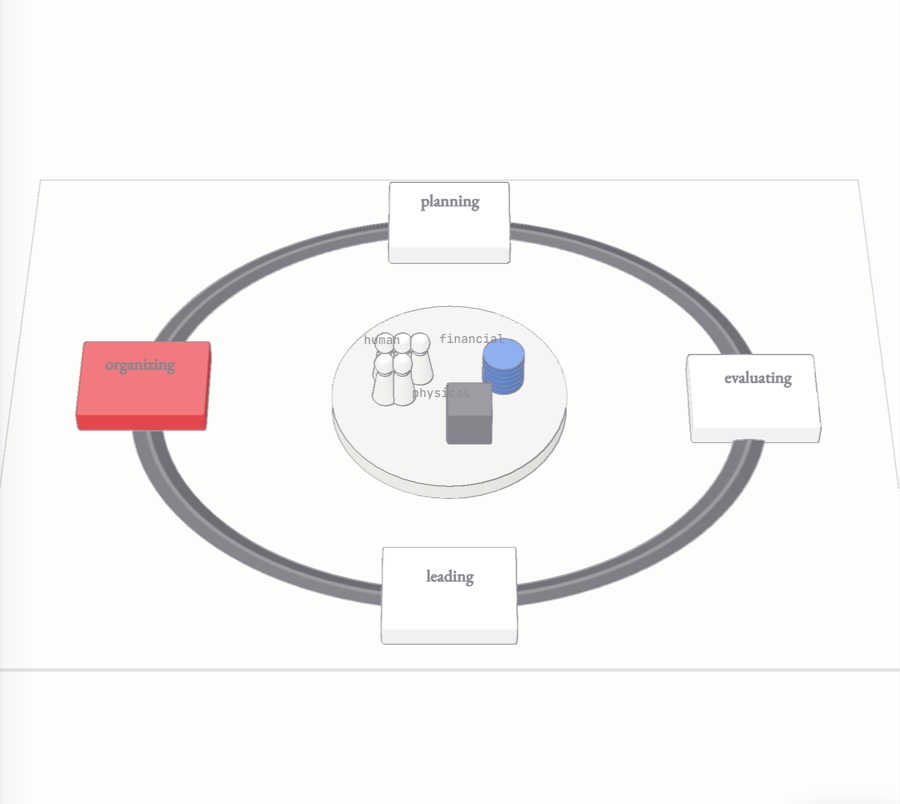
The four functions of management (planning, organizing, leading, evaluating) as paper stations on a ring around a business’s people, money and equipment, with the function at work raised in red
No. 0617 pages

Personal goals, budgeting, and investing
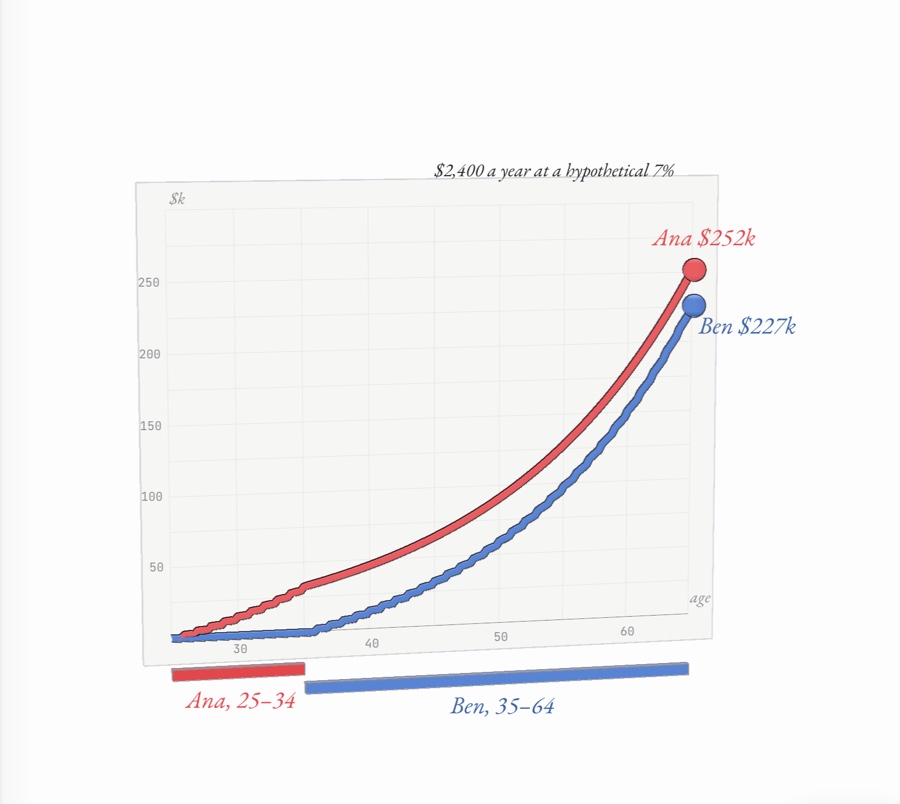
Two savers’ balances compounding on graph paper to age 65: Ana, who saved from 25 to 34 (red), ends above Ben, who saved from 35 to 64 (blue)