AtlasLog in

Grades 9–12 and AP

High School math

Math3

Precalculus

AP Precalculus

No. 0115 pages

Polynomial and rational functions
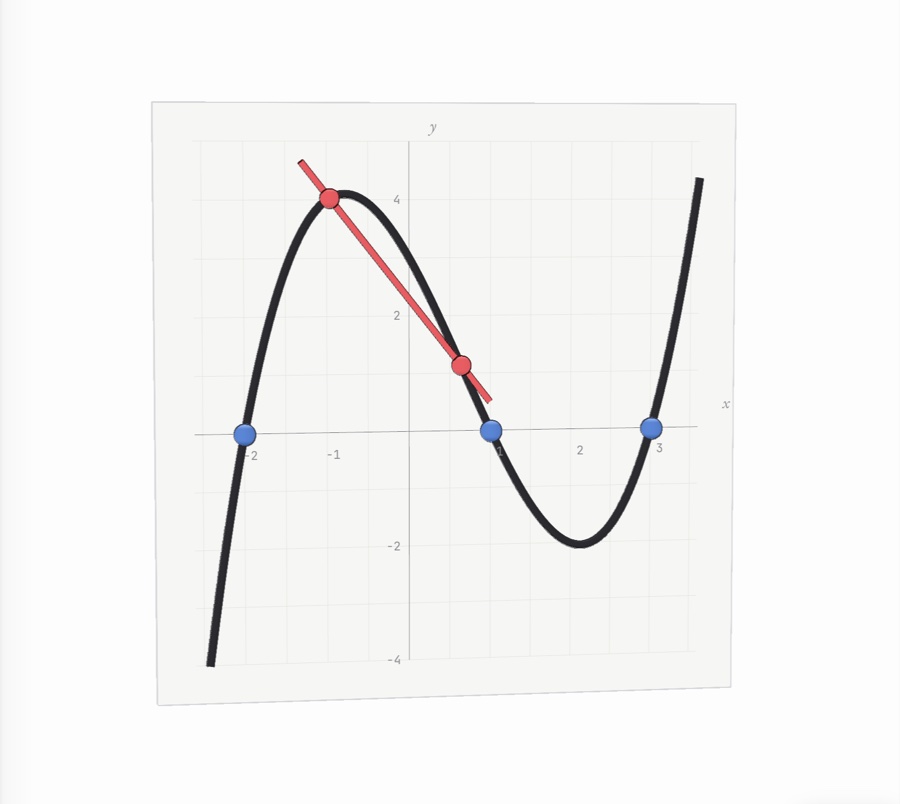
The graph of a cubic polynomial on graph paper, with its zeros marked and a red secant line across one interval
No. 0216 pages

Exponential and logarithmic functions
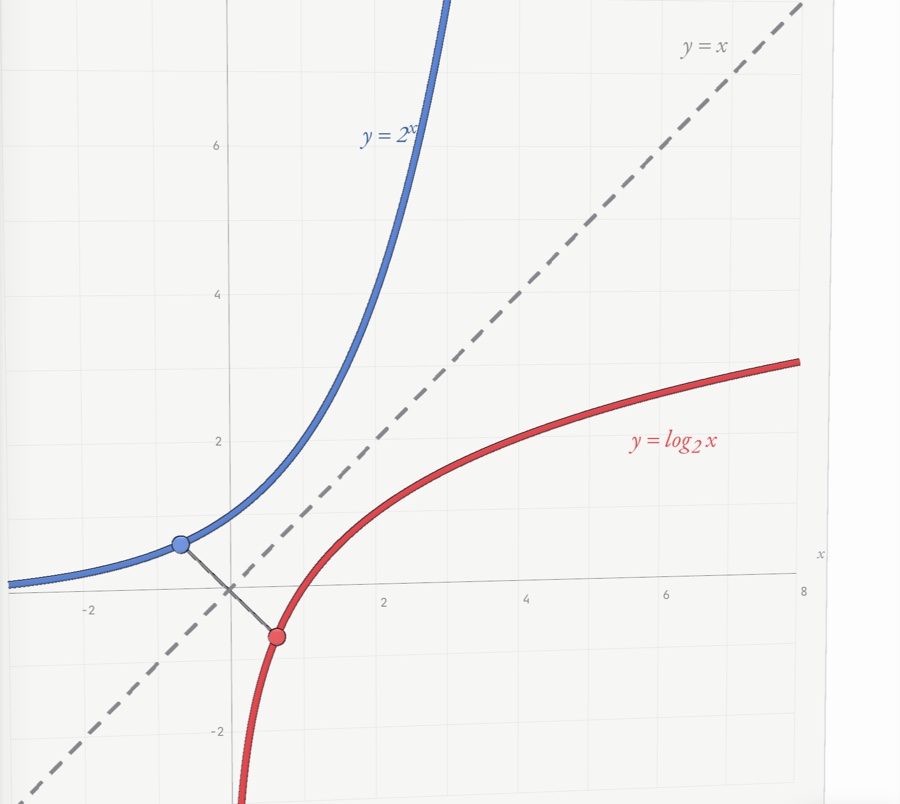
An exponential curve and its reflection, the logarithm, across the line y = x
No. 0316 pages

Trigonometric and polar functions
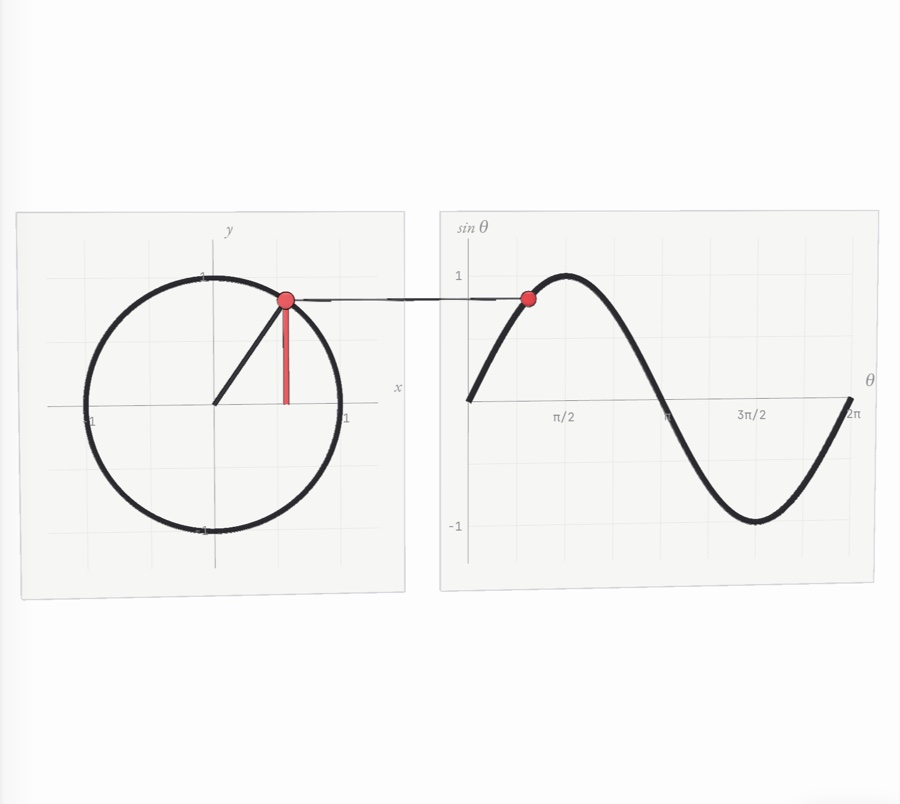
A point turning on the unit circle beside the sine curve it traces out
No. 0415 pages

Parameters, vectors and matrices
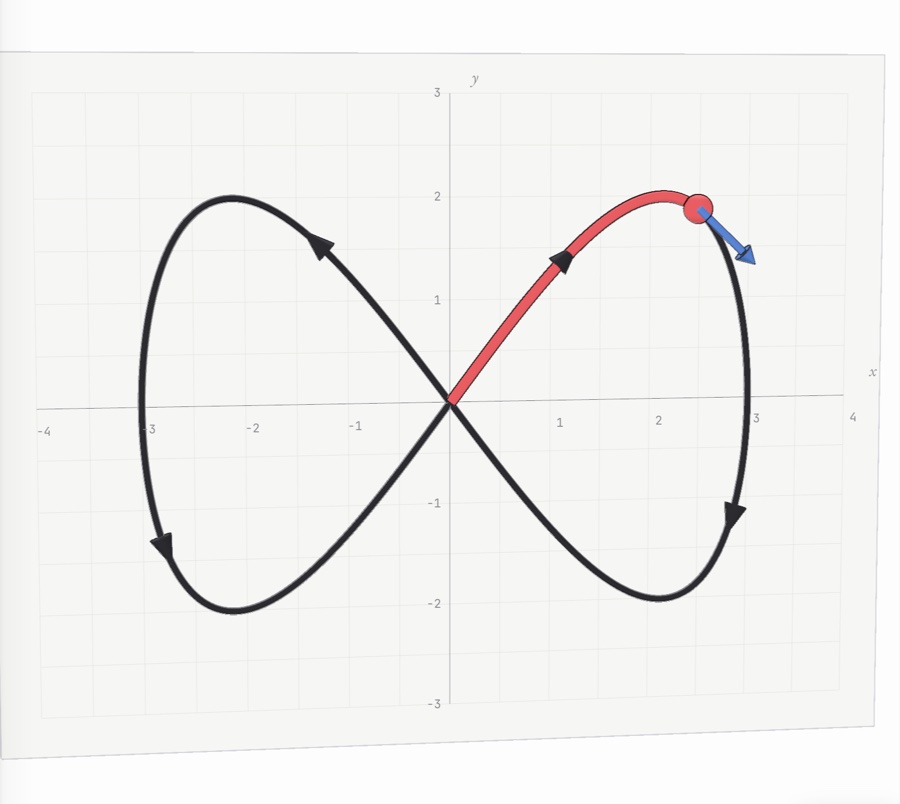
A path in the plane traced by a moving point, with its velocity vector drawn as an arrow

Calculus

AP Calculus AB

No. 0117 pages

Limits and continuity
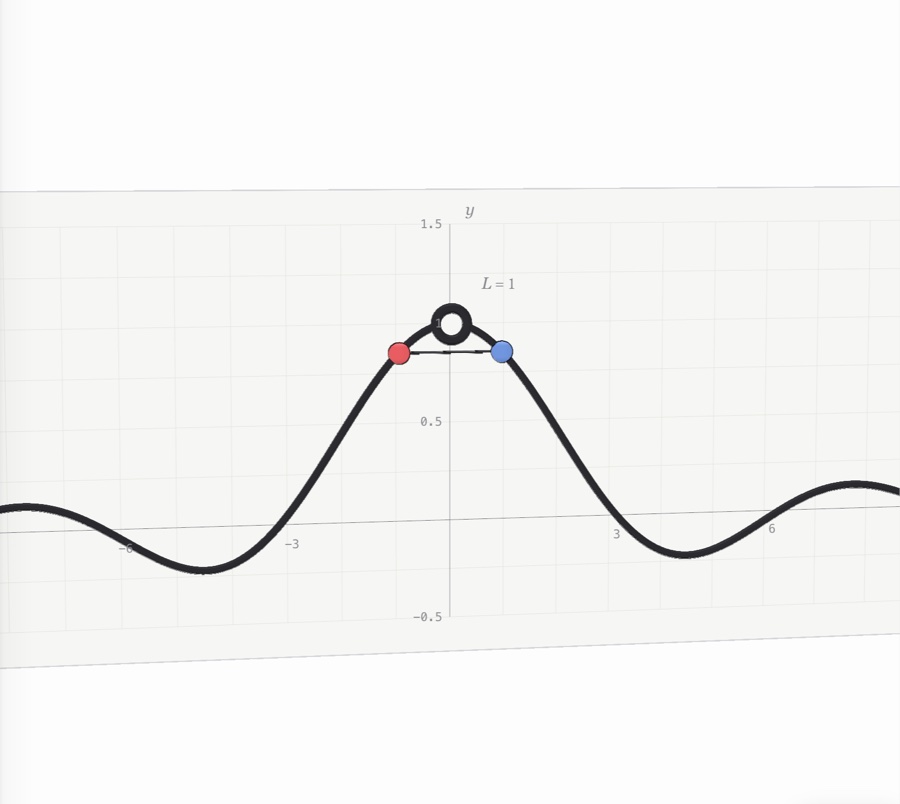
The graph of y = sin x / x on graph paper, with an open circle at (0, 1) and a red and a blue point sliding toward it from either side
No. 0211 pages

Derivatives

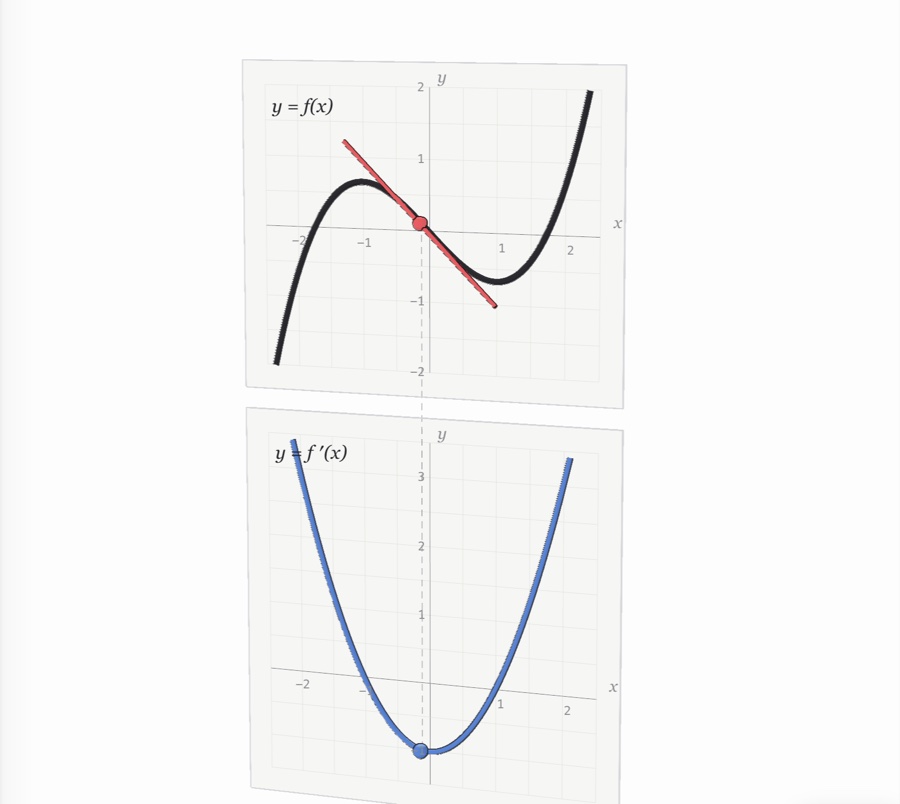
The graph of f(x) = x³/3 − x with a red tangent line, above the graph of its derivative, where a blue dot marks the tangent’s slope
No. 0310 pages

Composite, implicit and inverse
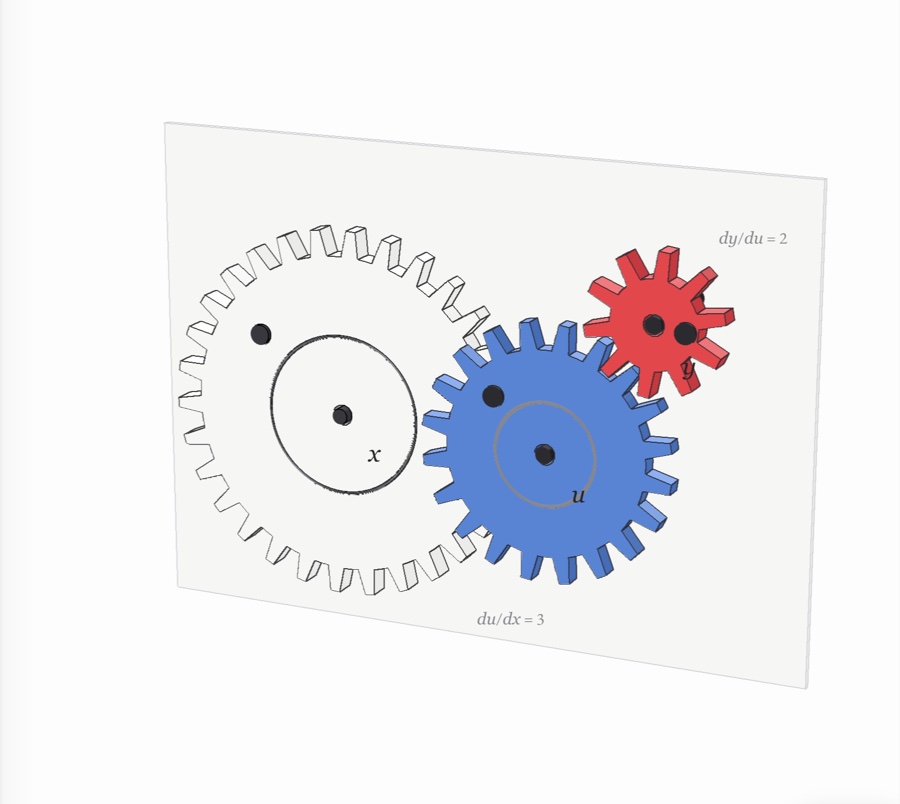
Three meshing gears whose turning rates multiply: du/dx = 3, dy/du = 2
No. 0414 pages

Derivatives in context
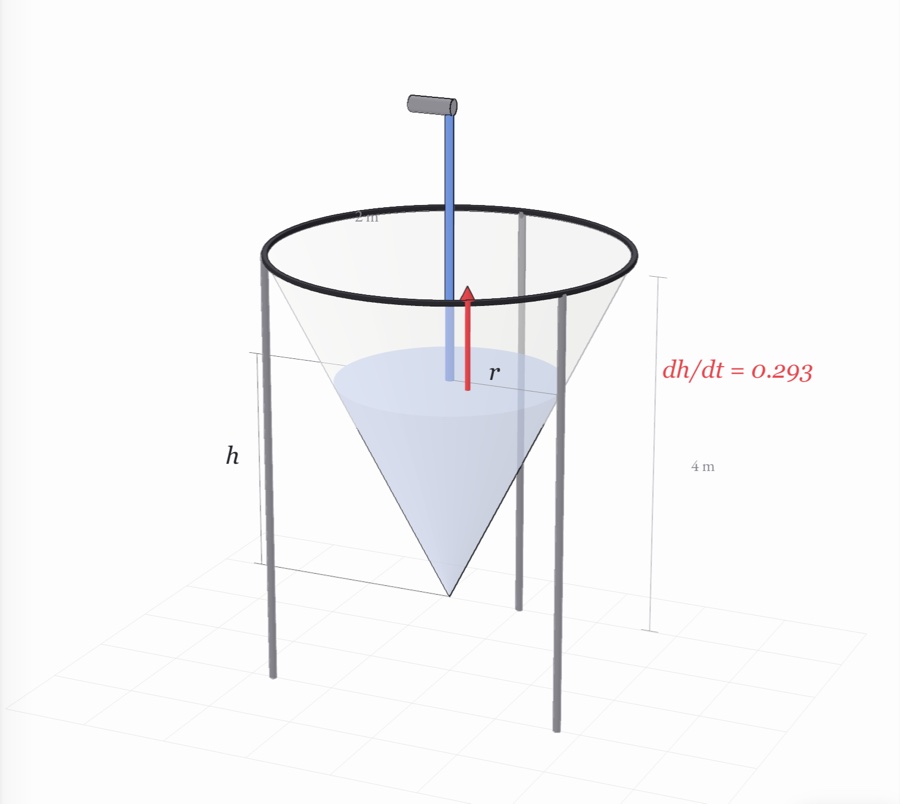
An inverted conical tank filling with water, its depth and surface radius marked
No. 0513 pages

Analyzing functions

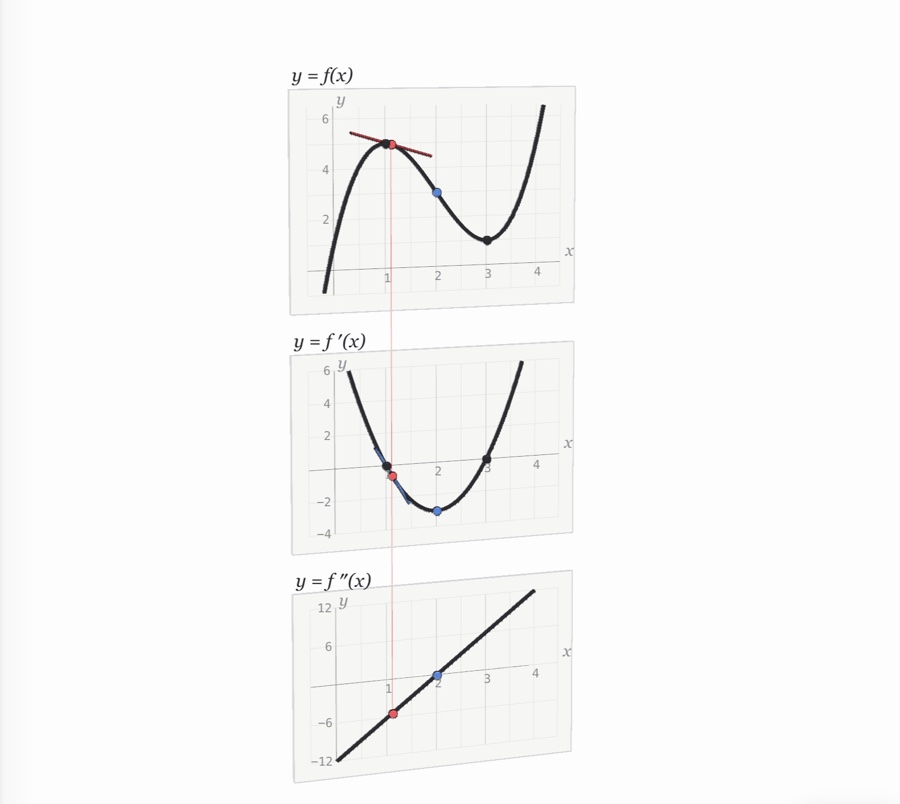
The graph of a cubic stacked above its first and second derivatives, with its peak, valley and inflection point marked
No. 0615 pages

Integration

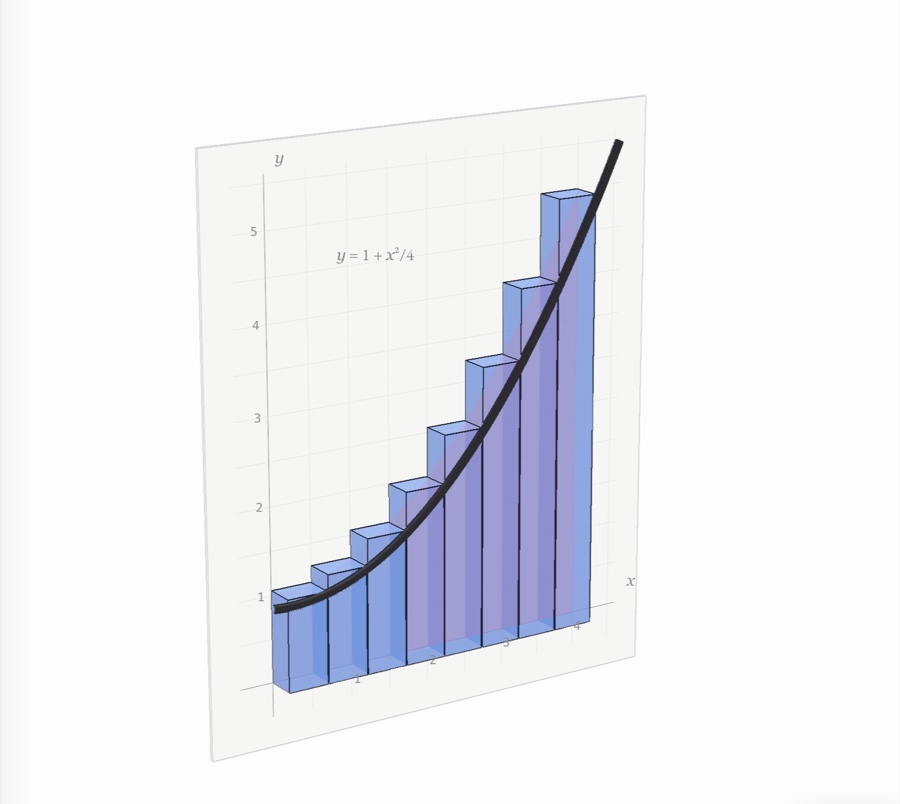
Rectangles standing under a curve, nearly filling the area beneath it
No. 0710 pages

Differential equations
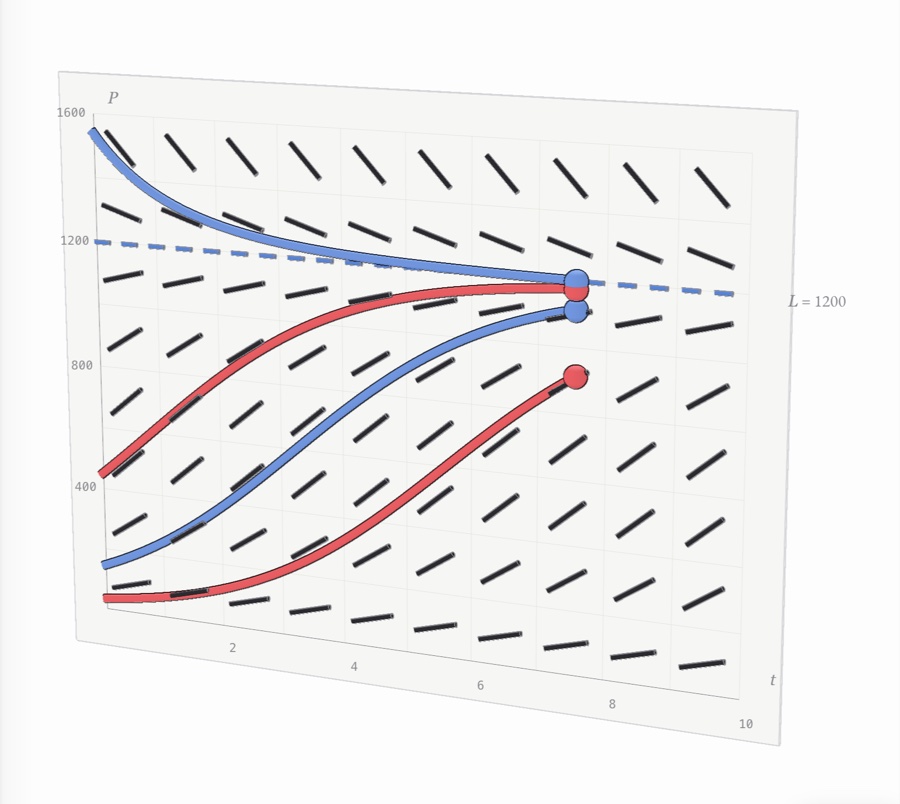
A slope field with four population curves leveling off at the carrying capacity
No. 0814 pages

Applications of integration
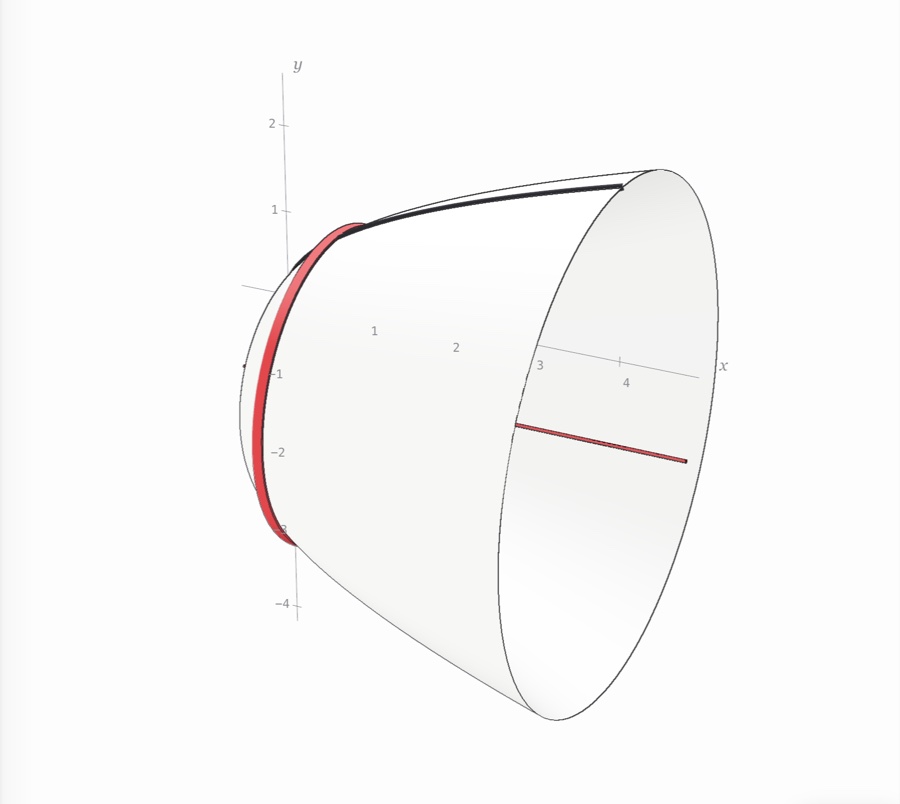
A region swept round a line into a solid with a hole, each slice a washer

AP Calculus BC

No. 0912 pages

Parametric, polar and vector
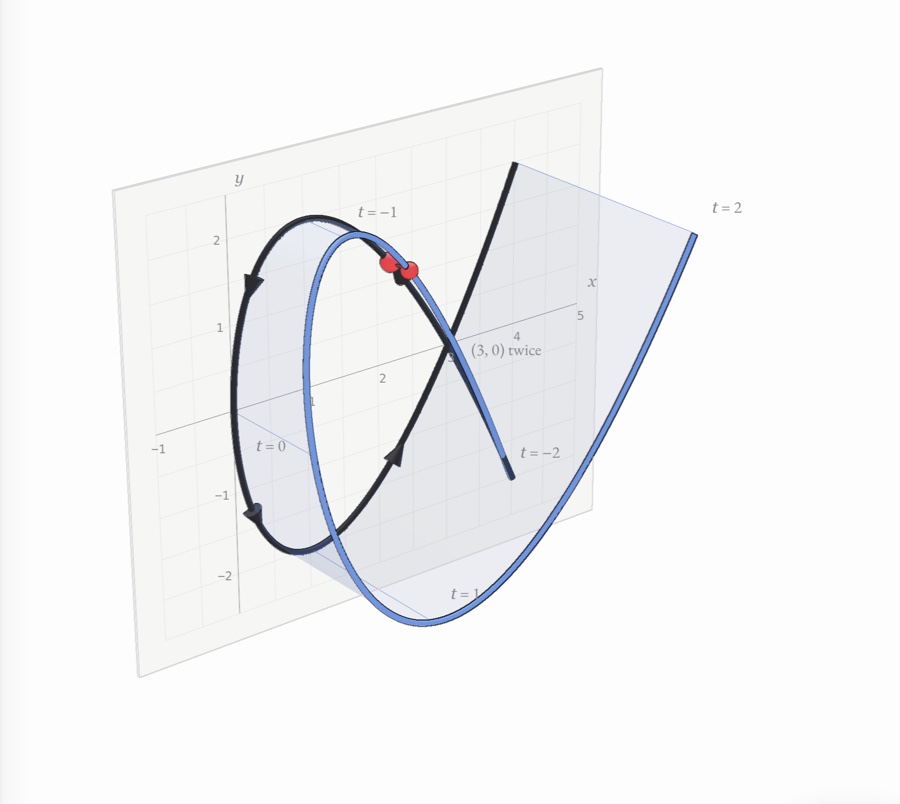
A looping parametric path on graph paper, with a curve rising out of the page that lifts each point by its time
No. 1016 pages

Infinite series

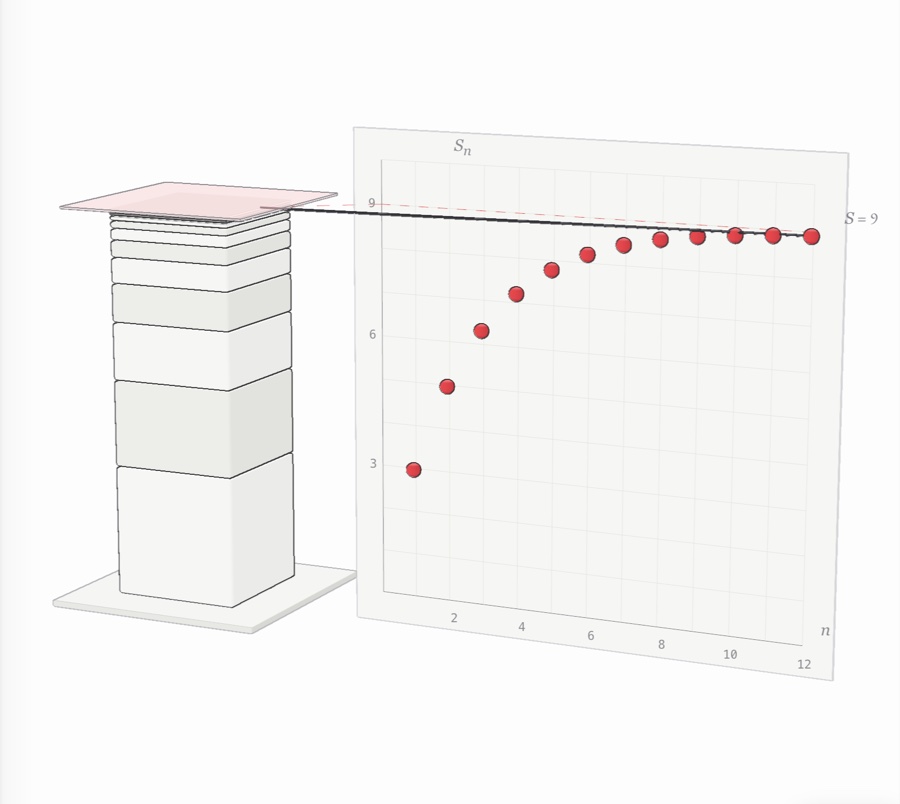
A tower of slabs, each two-thirds as tall as the one below, under a ceiling at 9, beside a graph of its partial sums

Statistics

AP Statistics

No. 0115 pages

Exploring one-variable data
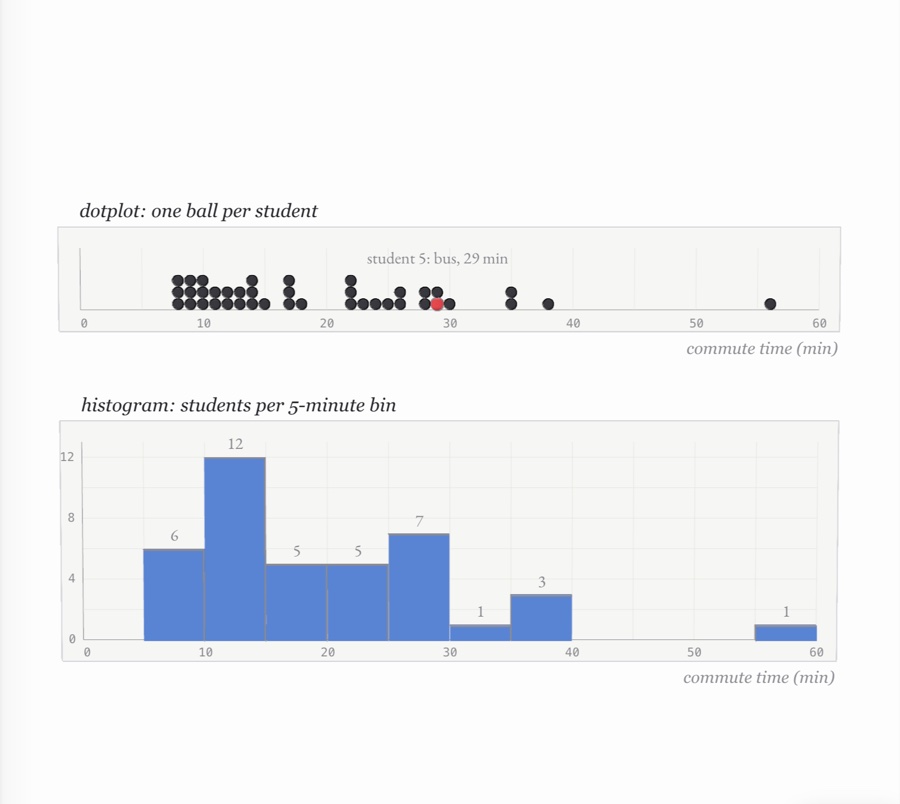
Forty commute times stacked as balls on a dotplot, one student in red, above a blue histogram of the same times in 5-minute bins
No. 0214 pages

Exploring two-variable data
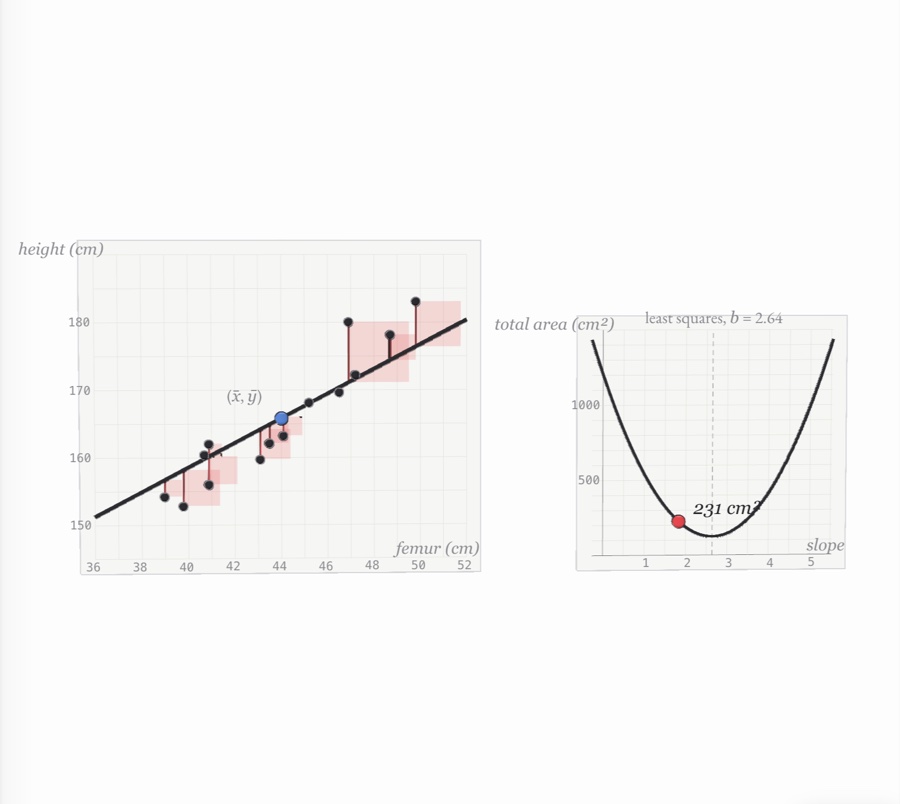
Femur length against height as balls on graph paper, a trial line turning through the mean point while red squares on each residual shrink, beside a parabola of total squared area against slope with its lowest point at the least-squares slope
No. 0314 pages

Collecting data

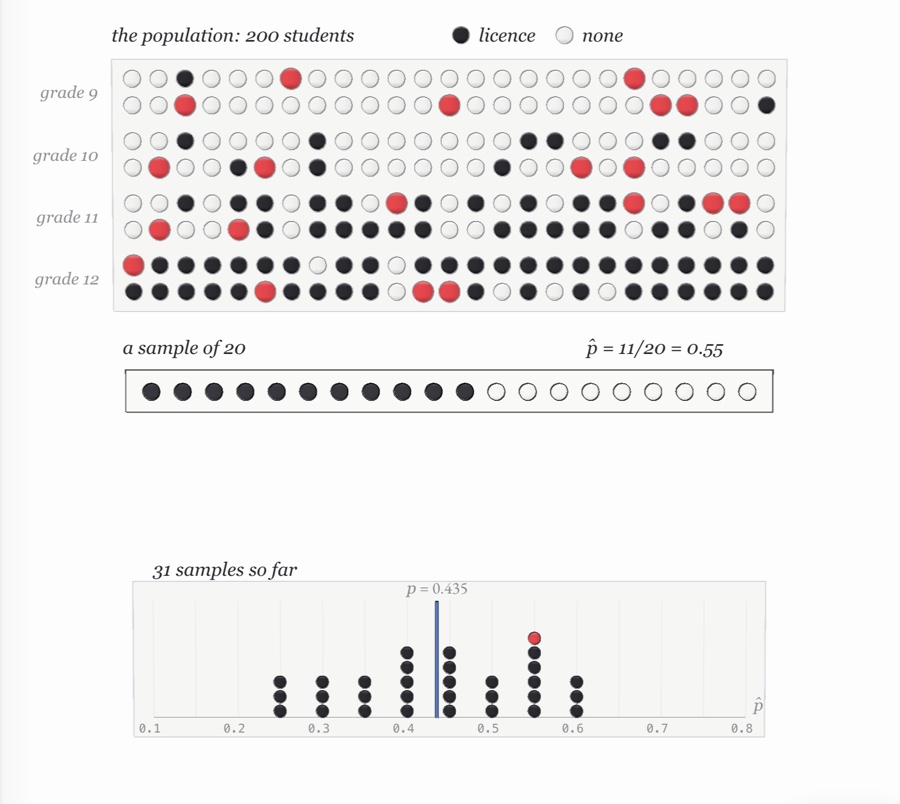
A school of 200 students drawn as rows of dark and white balls by grade, a random sample of 20 lit red and lined up below, and a dot plot of sample proportions piling up around the true proportion
No. 0415 pages

Probability and random variables
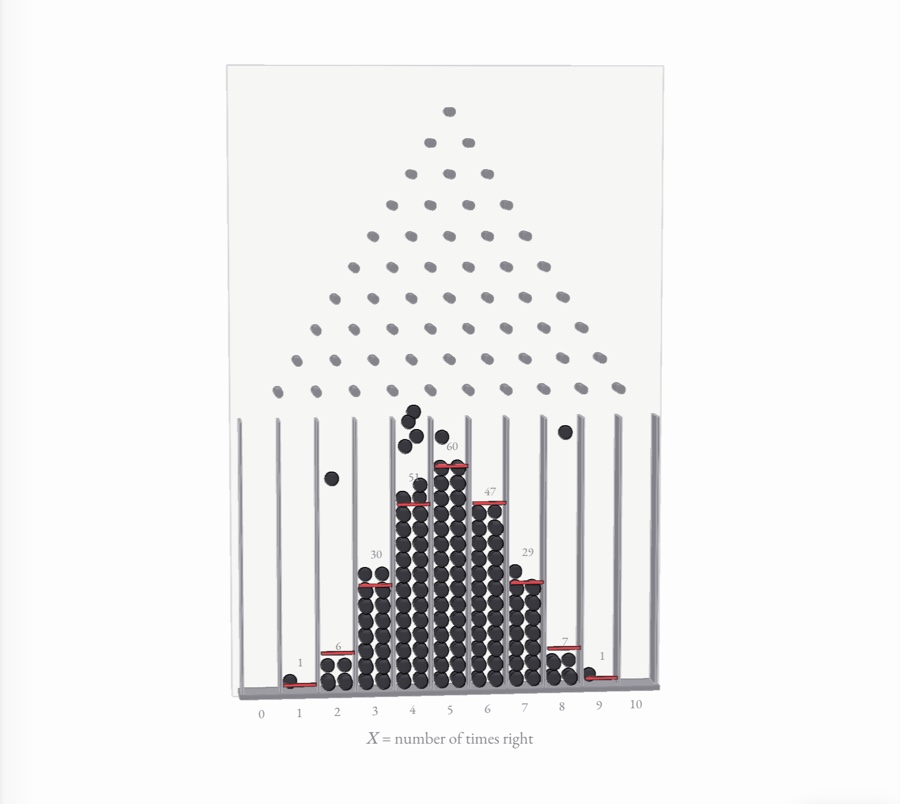
A Galton board: black balls fall through ten rows of pins and pile into eleven bins in a bell-shaped binomial heap, each stack beside a red mark at its expected height
No. 0512 pages

Sampling distributions
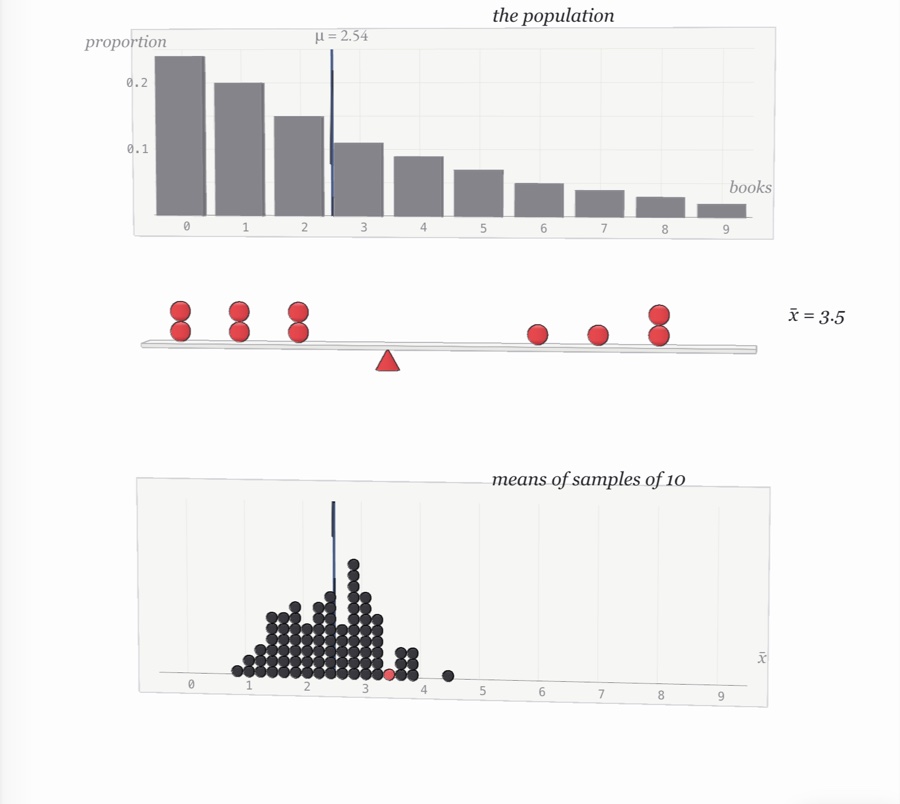
A skewed bar chart of how many books students read, a sample of ten red balls balanced on a cone at its mean, and a dotplot of many such sample means piling up in a narrow, symmetric heap around the population mean
No. 0614 pages

Inference for proportions
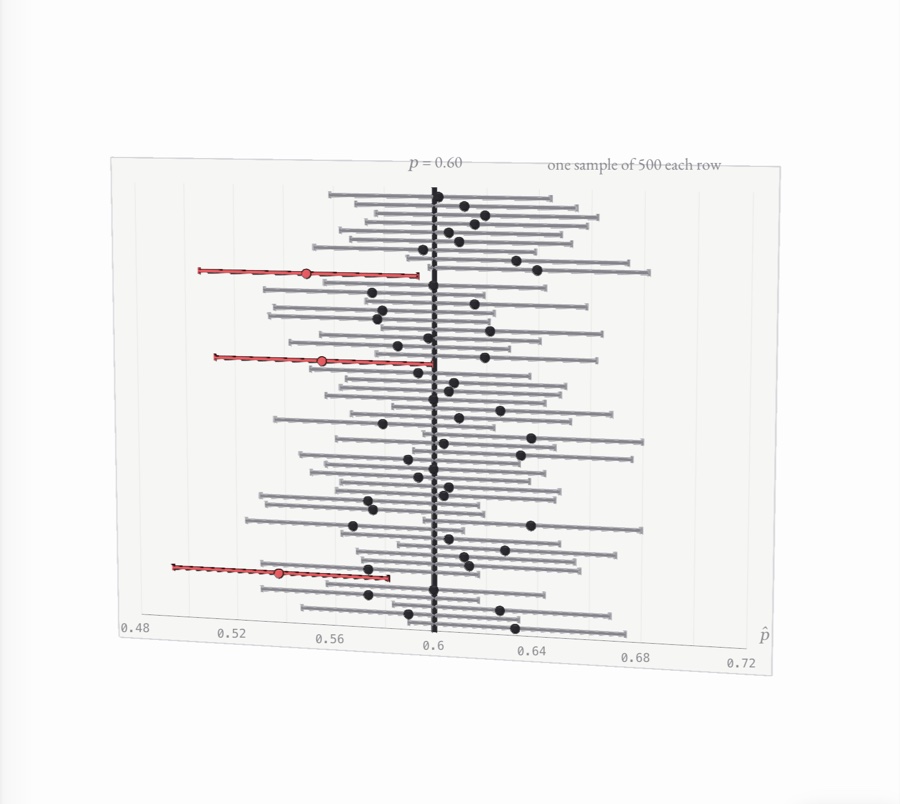
Fifty 95% confidence intervals from samples of 500 stacked as rods around a vertical line at the true proportion 0.60, the three that miss it in red
No. 0713 pages

Inference for means

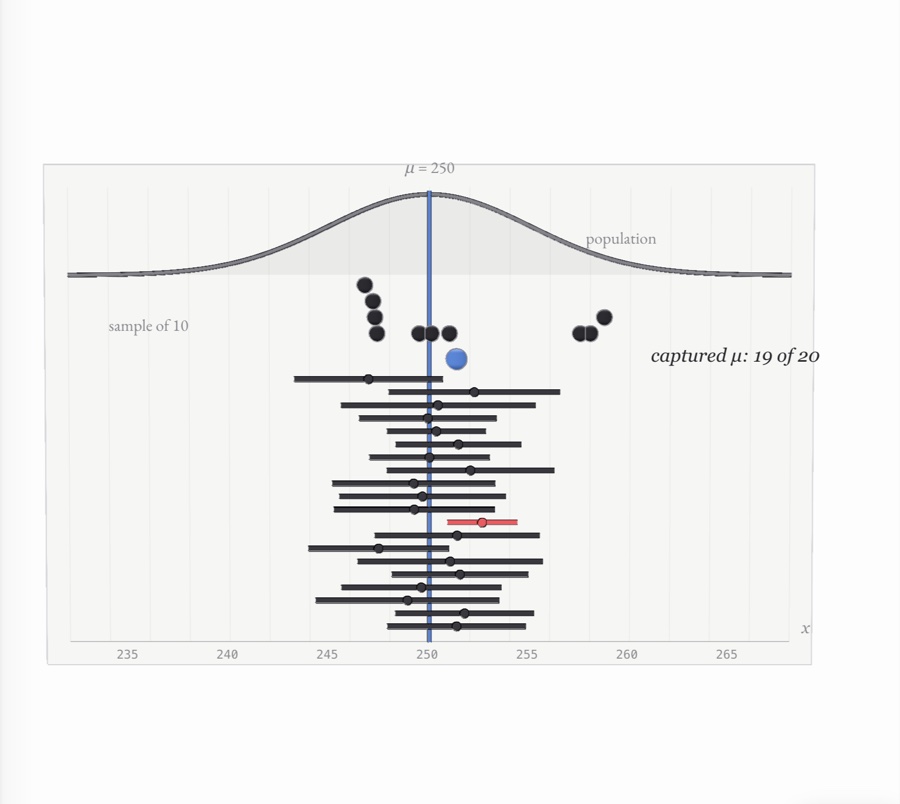
Twenty 95% t intervals stacked beneath a normal population curve, each built from its own random sample, a blue line marking the true mean μ = 250 through all of them; nineteen capture it and one, in red, misses
No. 0811 pages

Chi-square tests

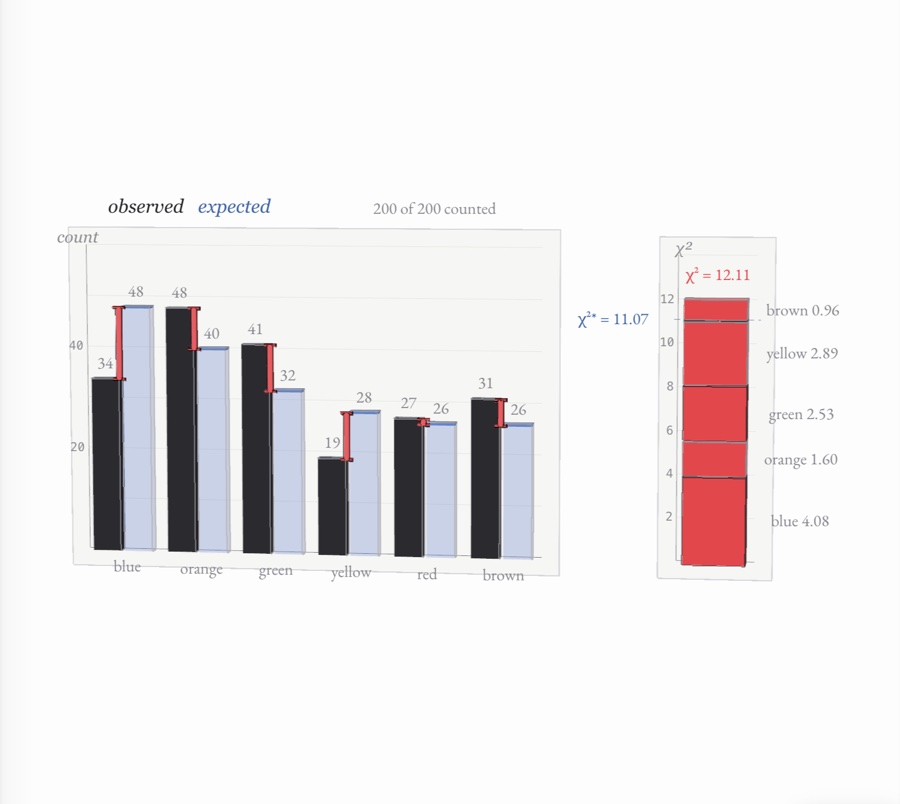
Black bars of observed candy counts stand beside pale blue bars of expected counts, red rods mark the gaps, and their squared, scaled contributions stack into a red column for χ² = 12.11, just past the critical value of 11.07
No. 0911 pages

Inference for slopes

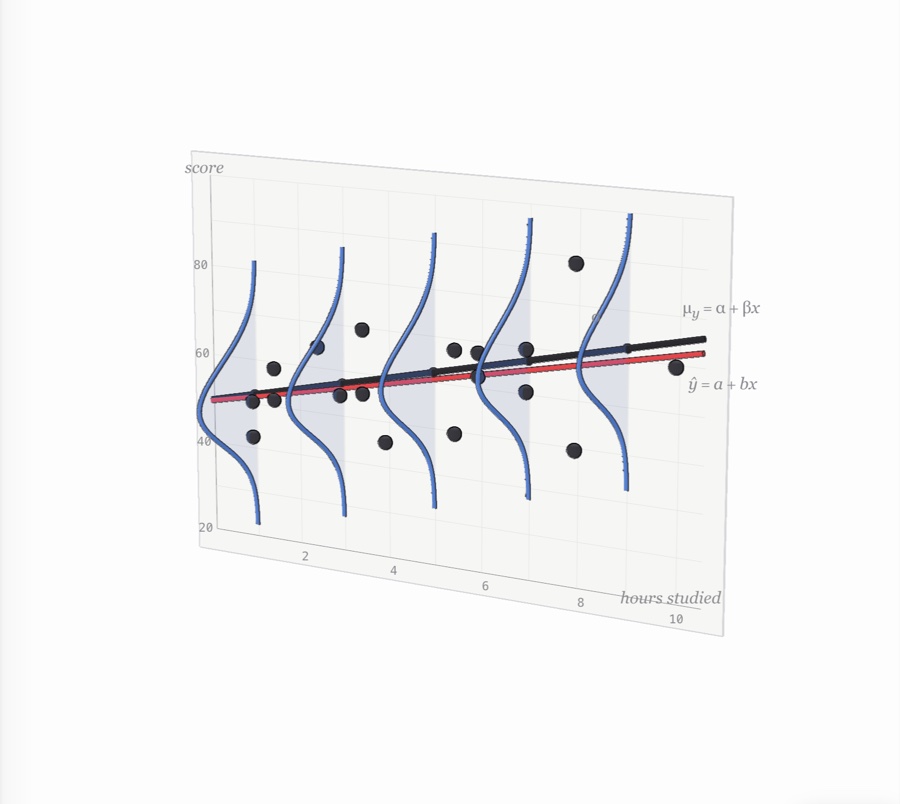
A sheet of graph paper of test score against hours studied, with blue normal curves standing up out of the paper along the black population line, a sample of students’ scores scattered about it, and their red fitted line