AtlasLog in

Data, taken apart.

Learn each unit with in-depth visuals and explanations

Equation sheet →

AP Statistics

9 chapters
No. 0115 pages

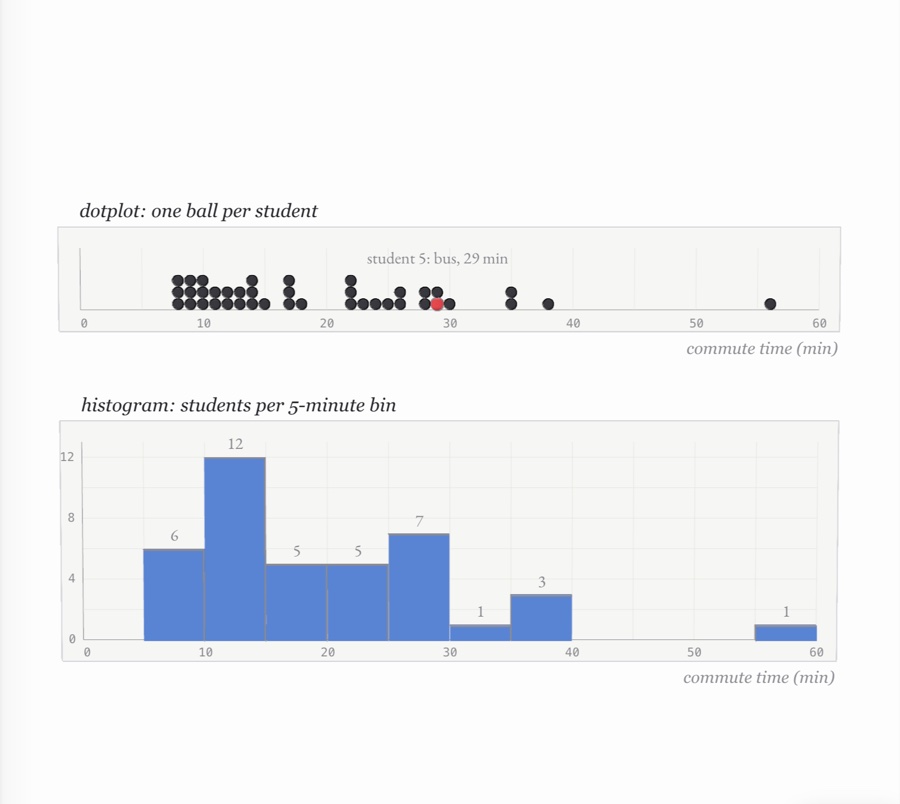
Exploring one-variable data

shape, centre and spread Forty commute times stacked as balls on a dotplot, one student in red, above a blue histogram of the same times in 5-minute bins
No. 0214 pages

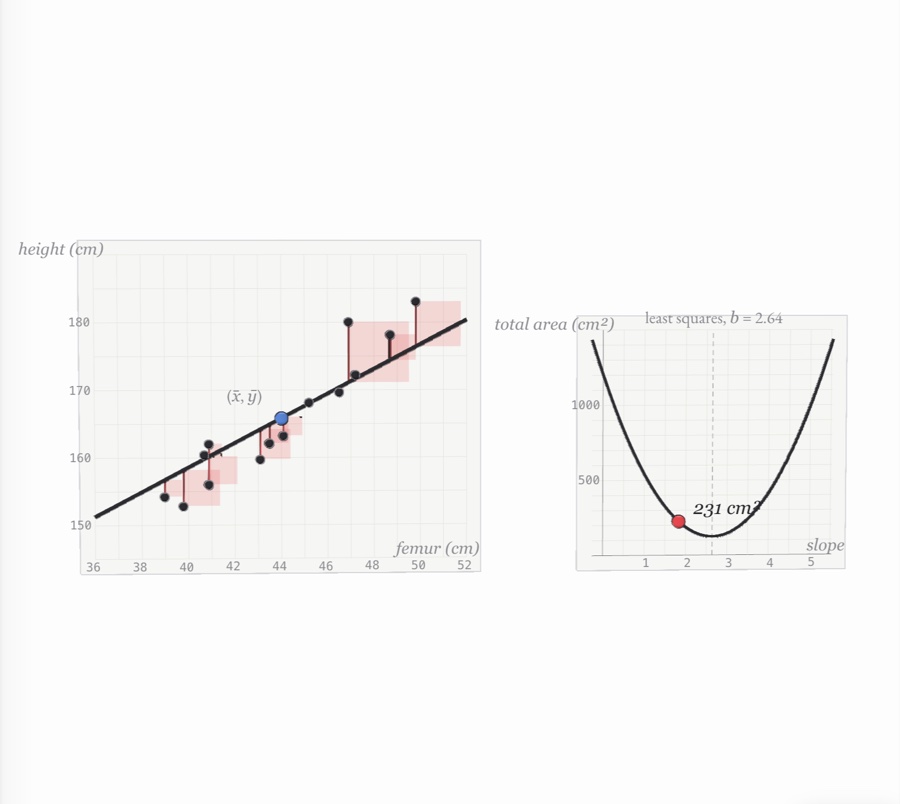
Exploring two-variable data

scatterplots and the least-squares line Femur length against height as balls on graph paper, a trial line turning through the mean point while red squares on each residual shrink, beside a parabola of total squared area against slope with its lowest point at the least-squares slope
No. 0314 pages

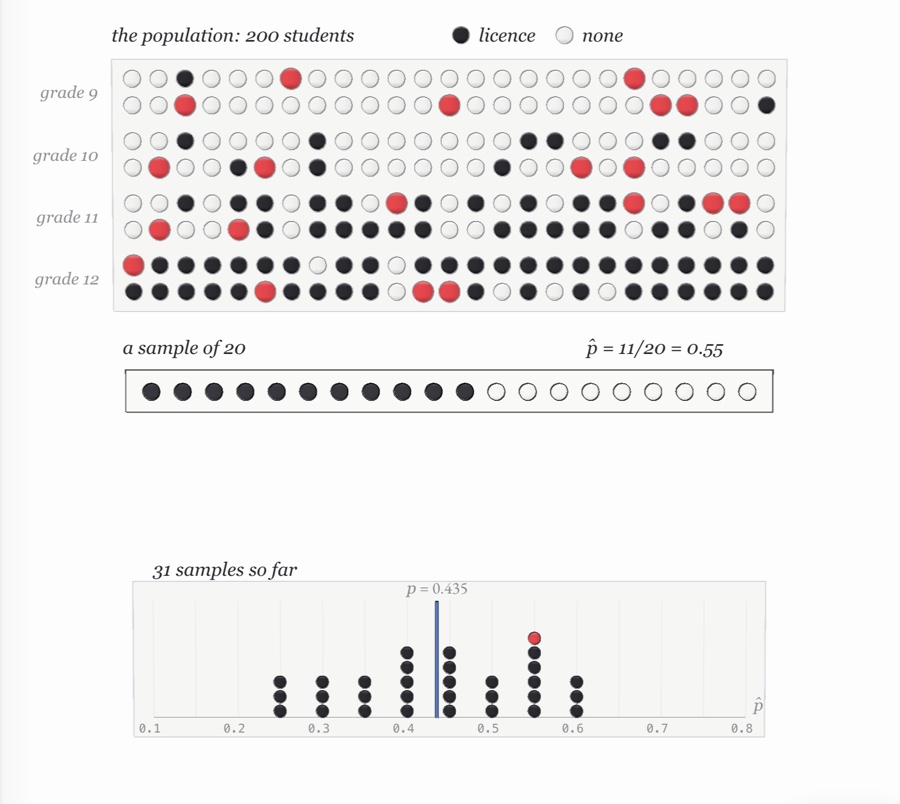
Collecting data

samples, experiments and bias A school of 200 students drawn as rows of dark and white balls by grade, a random sample of 20 lit red and lined up below, and a dot plot of sample proportions piling up around the true proportion
No. 0415 pages

Probability and random variables

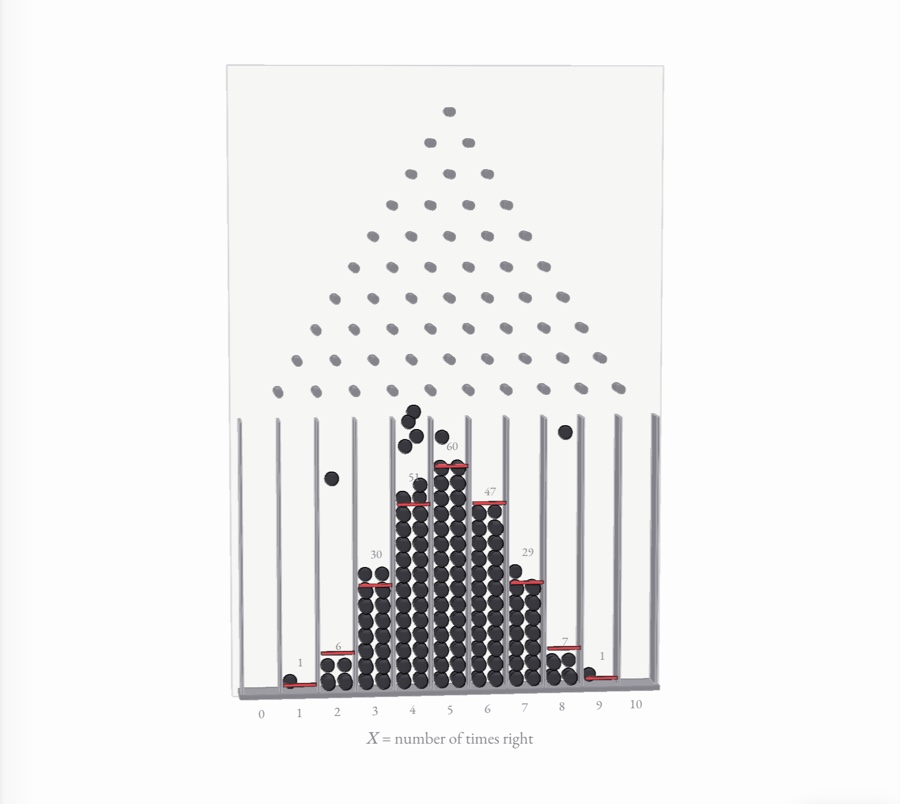
chance, counted A Galton board: black balls fall through ten rows of pins and pile into eleven bins in a bell-shaped binomial heap, each stack beside a red mark at its expected height
No. 0512 pages

Sampling distributions

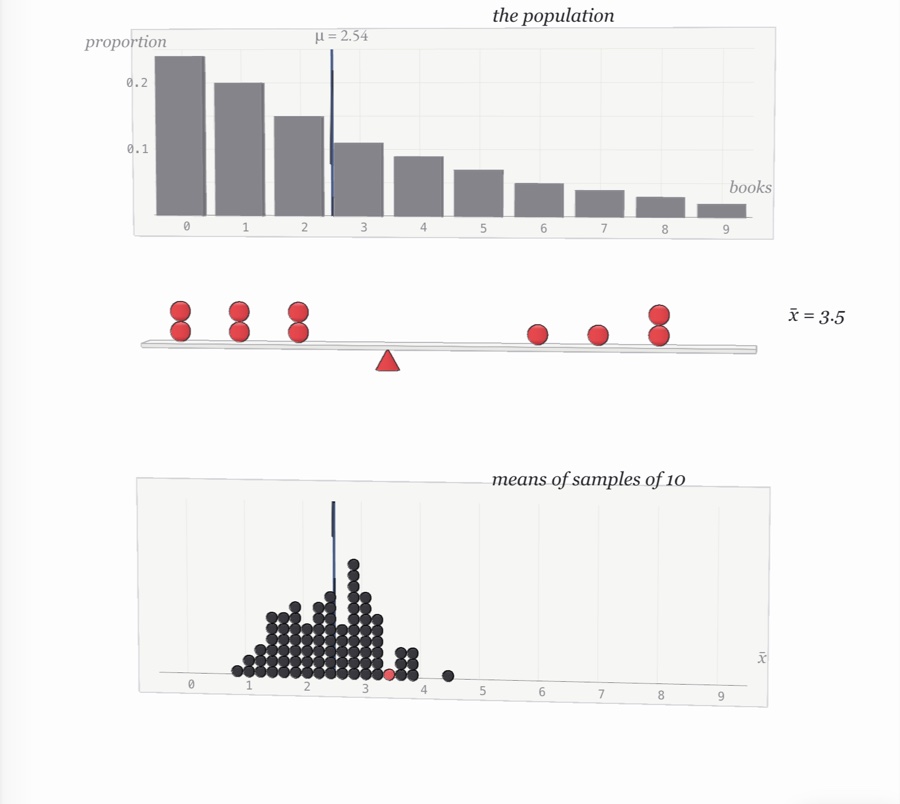
how a statistic varies A skewed bar chart of how many books students read, a sample of ten red balls balanced on a cone at its mean, and a dotplot of many such sample means piling up in a narrow, symmetric heap around the population mean
No. 0614 pages

Inference for proportions

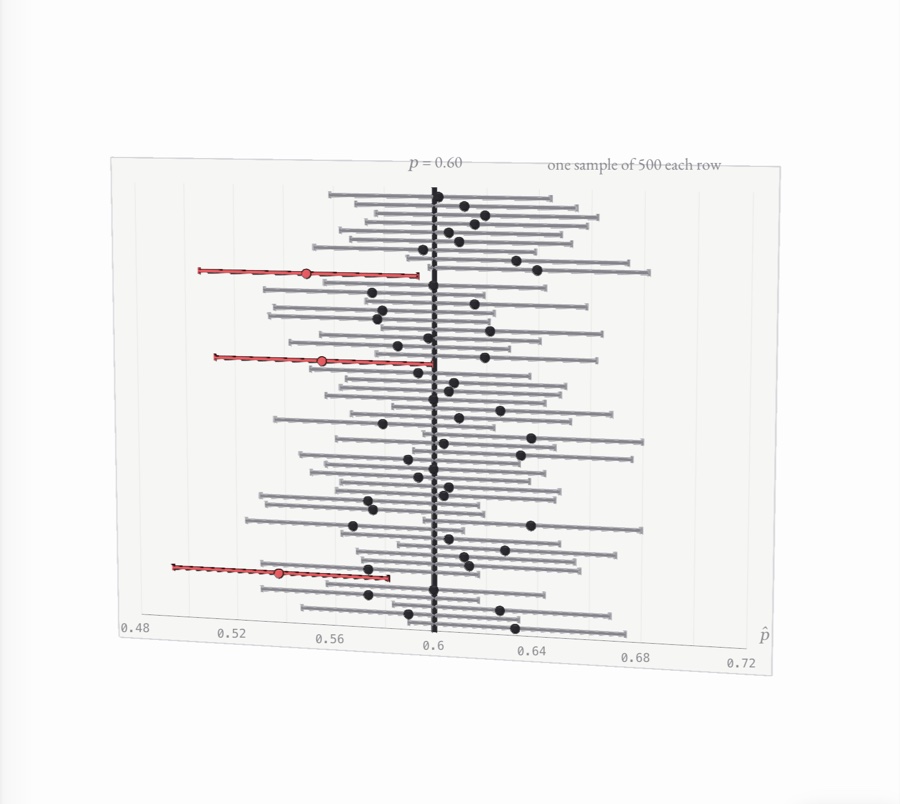
intervals and tests for p Fifty 95% confidence intervals from samples of 500 stacked as rods around a vertical line at the true proportion 0.60, the three that miss it in red
No. 0713 pages

Inference for means

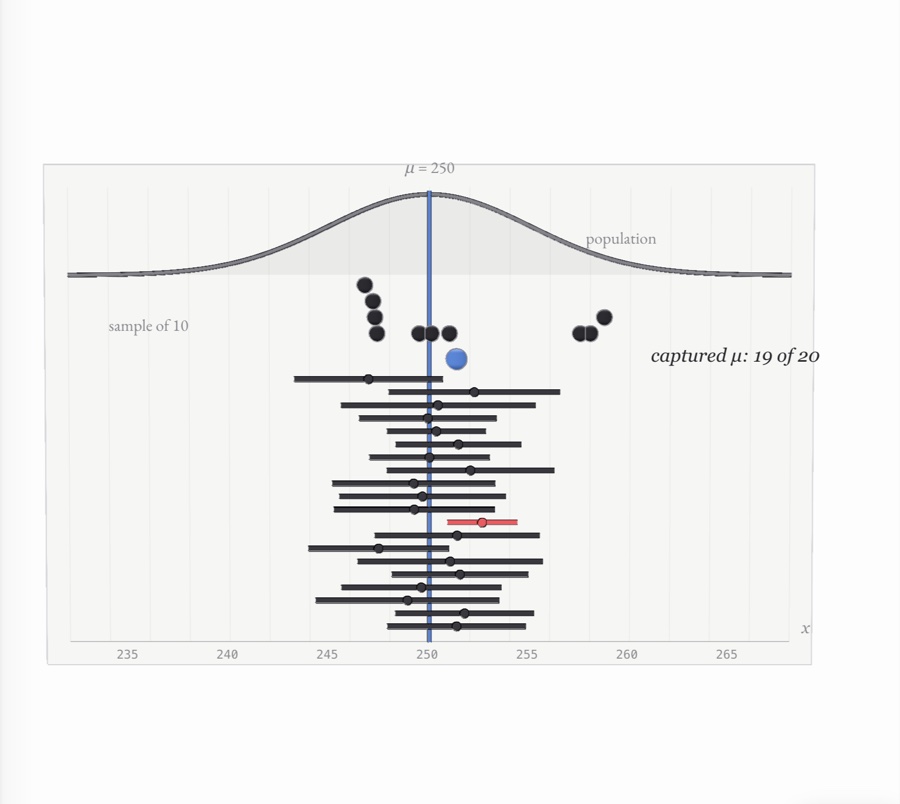
t procedures for μ Twenty 95% t intervals stacked beneath a normal population curve, each built from its own random sample, a blue line marking the true mean μ = 250 through all of them; nineteen capture it and one, in red, misses
No. 0811 pages

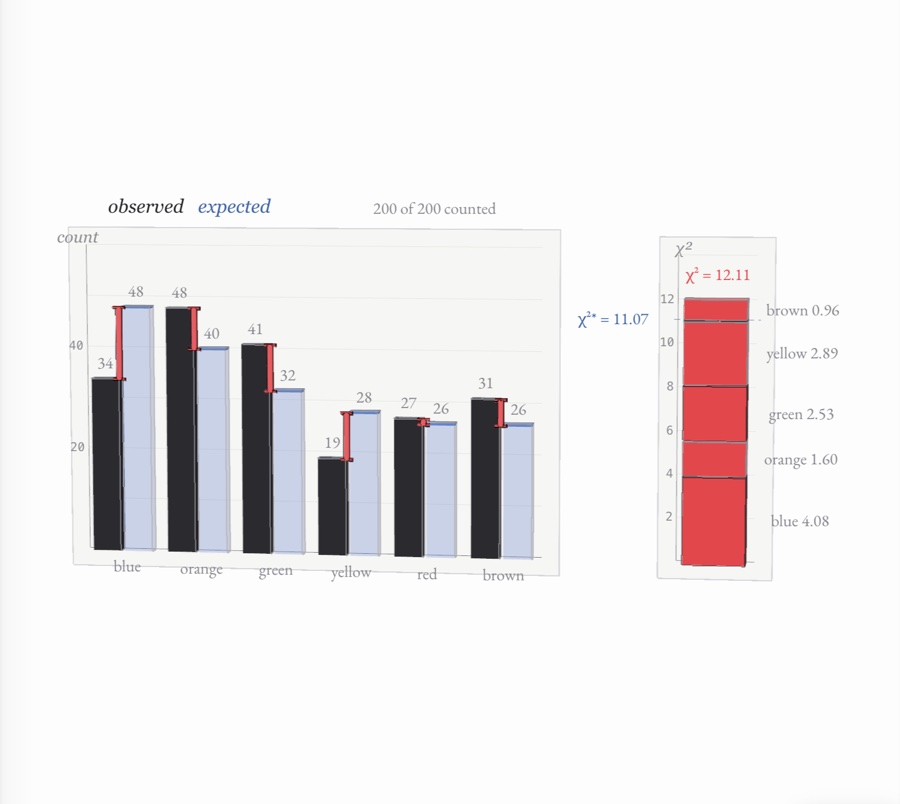
Chi-square tests

counts against expectations Black bars of observed candy counts stand beside pale blue bars of expected counts, red rods mark the gaps, and their squared, scaled contributions stack into a red column for χ² = 12.11, just past the critical value of 11.07
No. 0911 pages

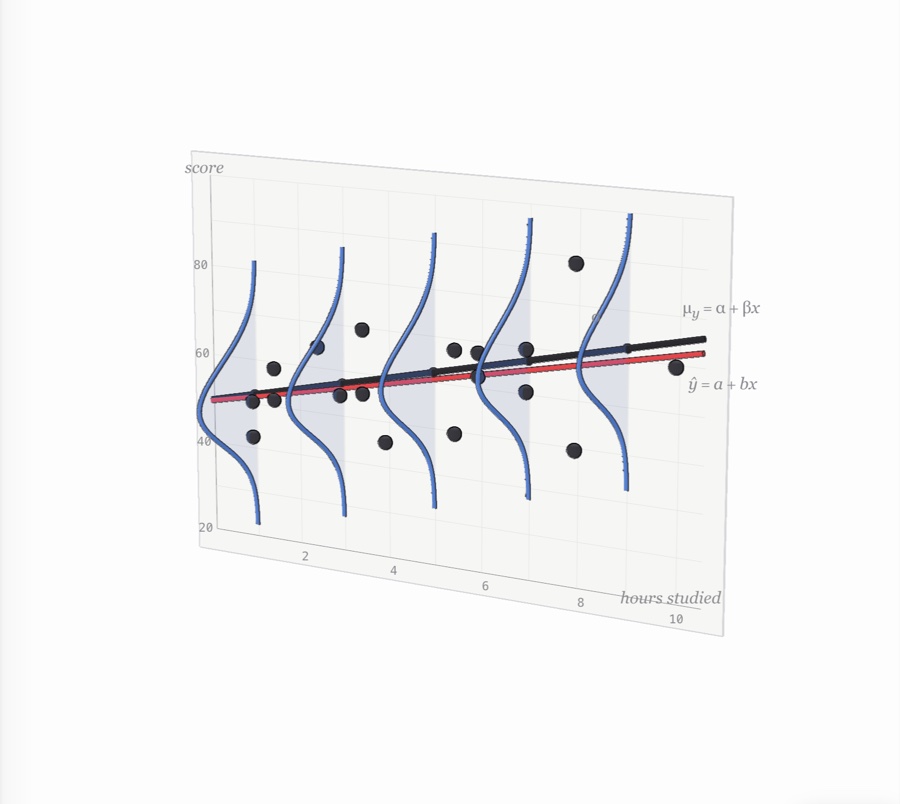
Inference for slopes

is the trend real? A sheet of graph paper of test score against hours studied, with blue normal curves standing up out of the paper along the black population line, a sample of students’ scores scattered about it, and their red fitted line