AtlasLog in

The economy, taken apart.

Learn each unit with in-depth visuals and explanations

AP Macroeconomics

6 chapters
No. 0114 pages

Basic economic concepts

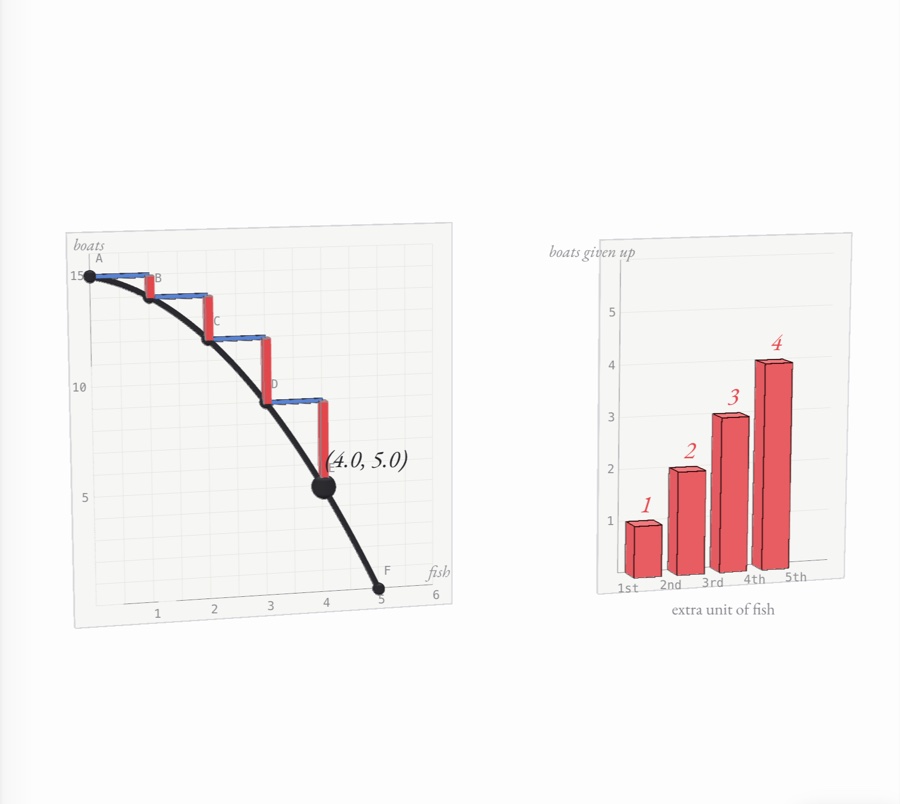
scarcity, trade and markets A bowed production possibilities curve for fish and boats on graph paper, a point walking down it in steps of blue (one more unit of fish) and red (boats given up), beside rising red bars of the opportunity cost of each extra unit of fish
No. 0212 pages

Economic indicators and the business cycle

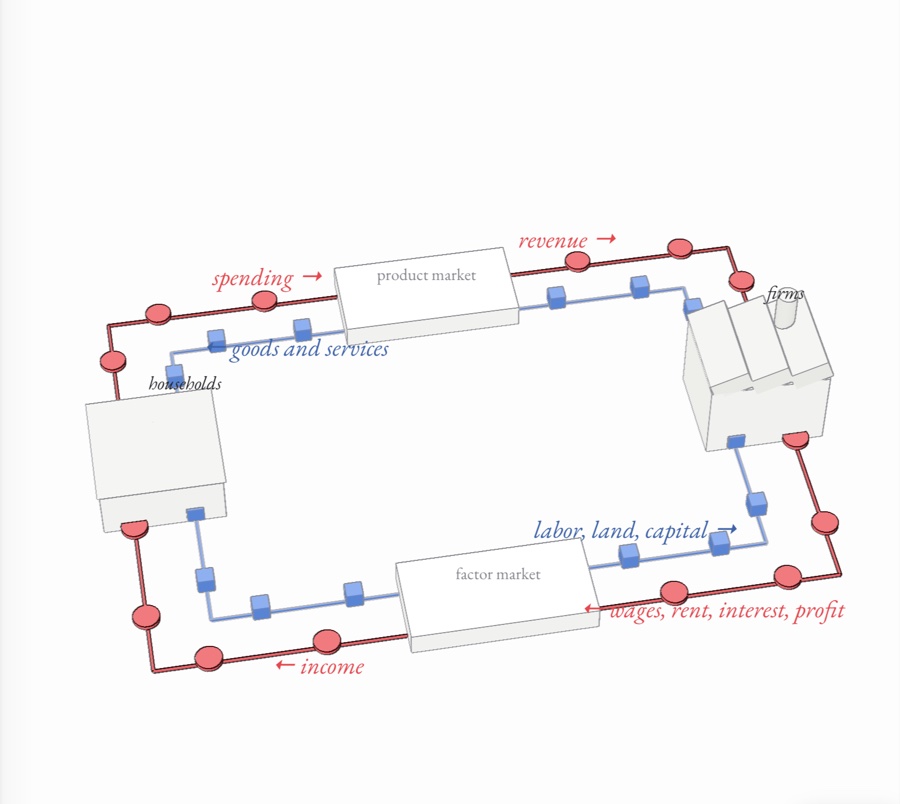
measuring an economy A circular flow seen from above: red coins of spending and income circle between households and firms through the product and factor markets, while blue goods and factors circle the other way
No. 0314 pages

National income and price determination

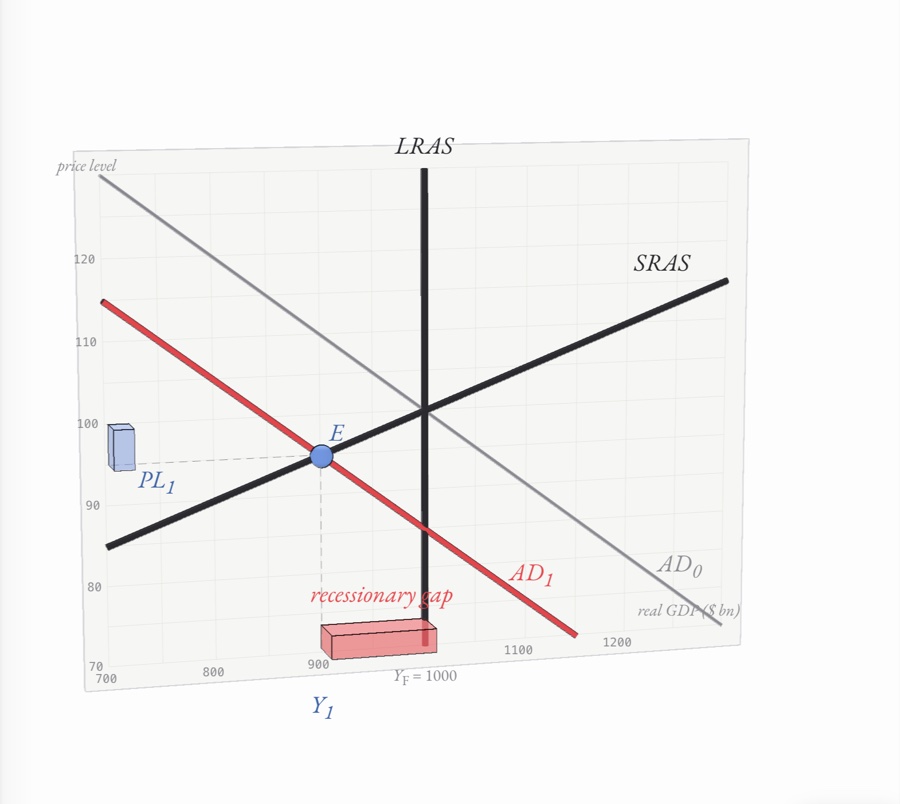
aggregate demand and supply Aggregate demand shifted left on an AD–AS graph, its equilibrium dot sliding down short-run aggregate supply, and the recessionary gap to the vertical LRAS rising from the paper as a red slab
No. 0413 pages

The financial sector

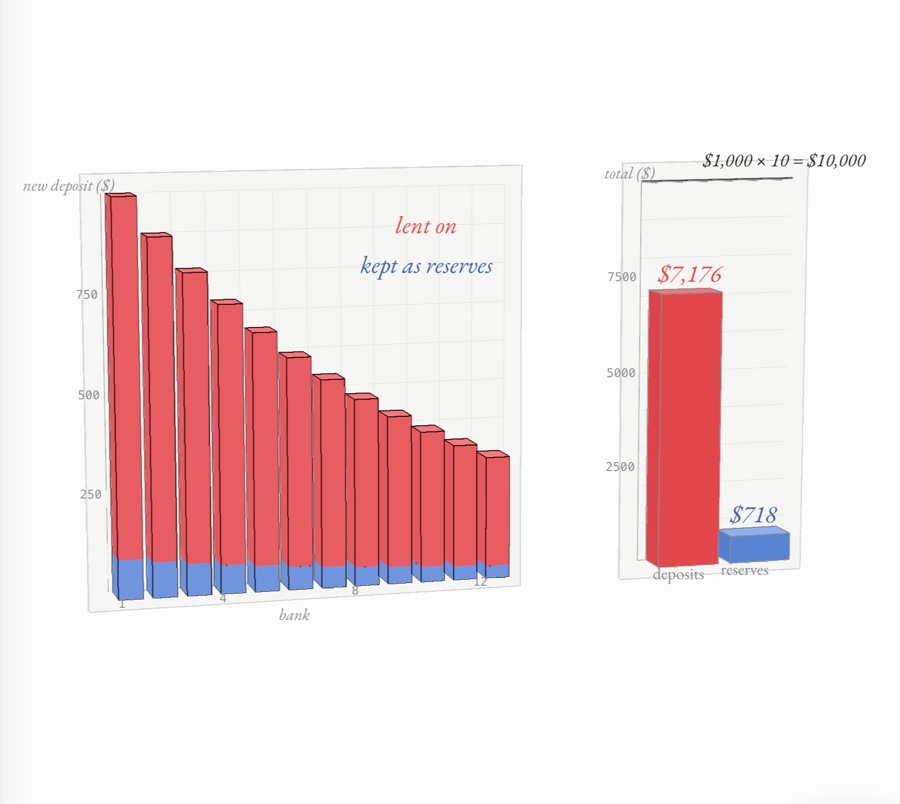
money, banks and the Fed Twelve bank deposits standing in a row, each red bar of new money 90% of the one before above a blue sliver of reserves kept, beside two columns adding them up toward a $10,000 limit and $1,000 of reserves
No. 0513 pages

Long-run consequences of stabilization policies

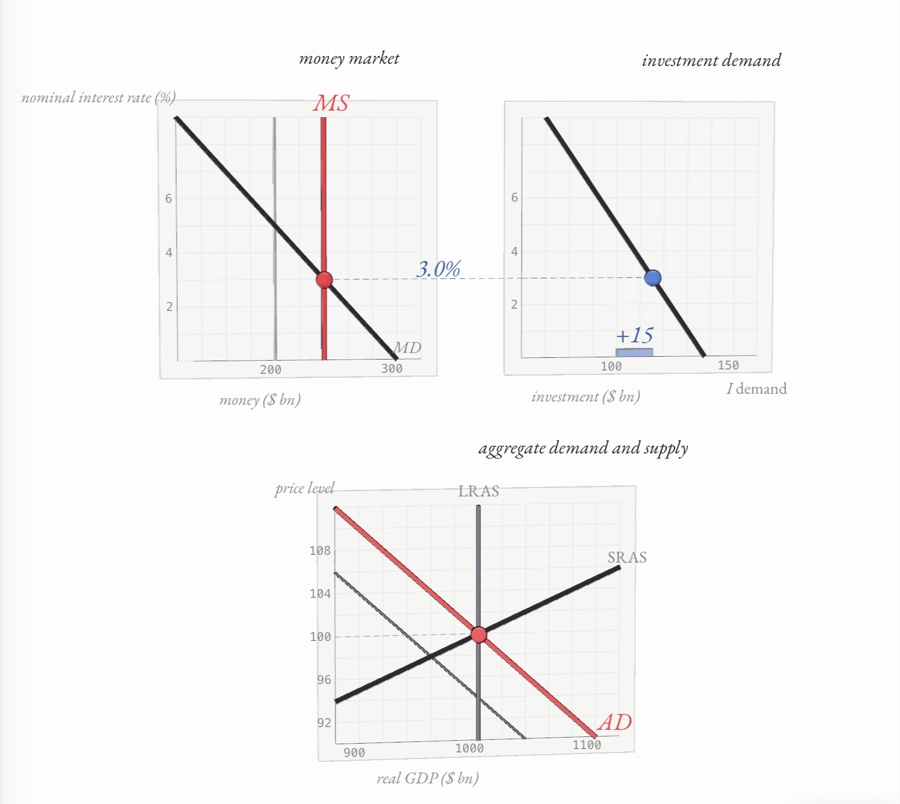
inflation, debt and growth Linked graphs on paper boards: the money supply shifted right in the money market, the lower interest rate carried across to higher investment, and aggregate demand moved right to close a recessionary gap at full-employment output
No. 0616 pages

Open economy: international trade and finance

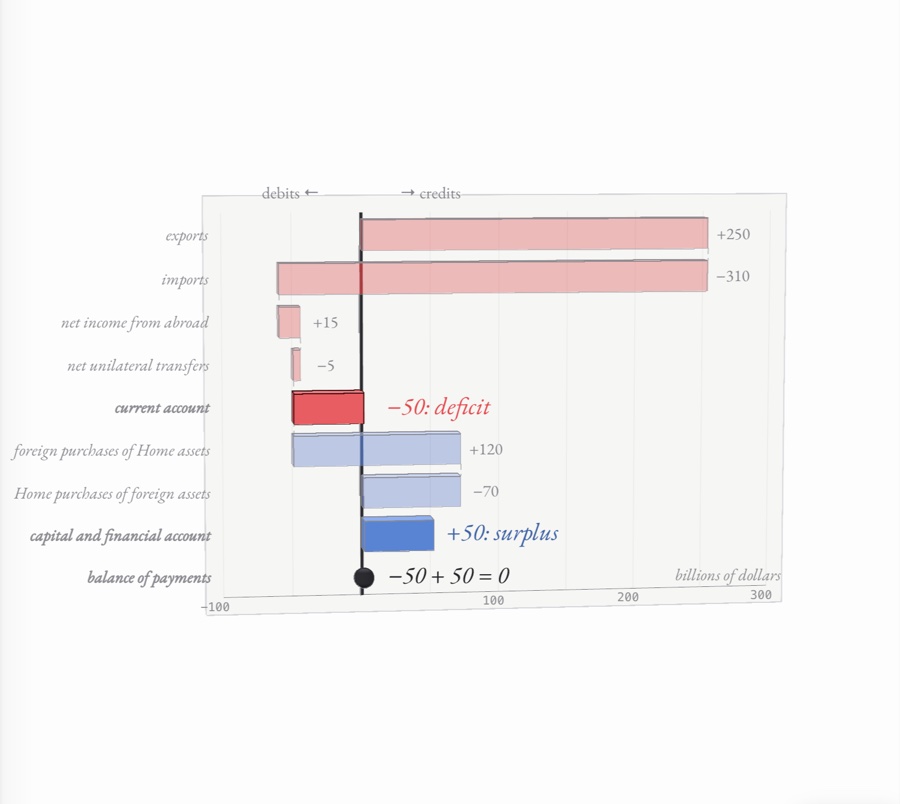
exchange rates and capital flows A hypothetical country’s balance of payments as a ledger: credits and debits stand as blocks around a zero line, a red current-account deficit of −50 matched by a blue capital and financial account surplus of +50, summing to zero